2 minutes
NBA Regular Season Blowouts
So, spending some time looking at NBA blouwouts in the playoffs over time in previous posts, I wondered about blowouts in the regular season.
I found a dataset on Kaggle Datasets that had data from the very start of the NBA up until today.
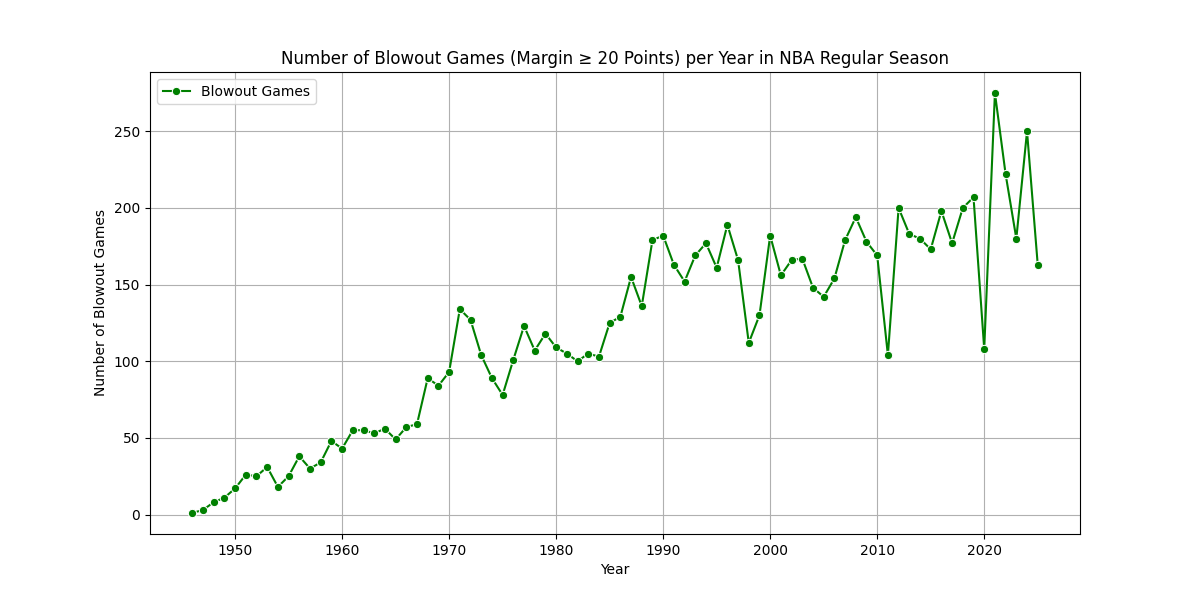
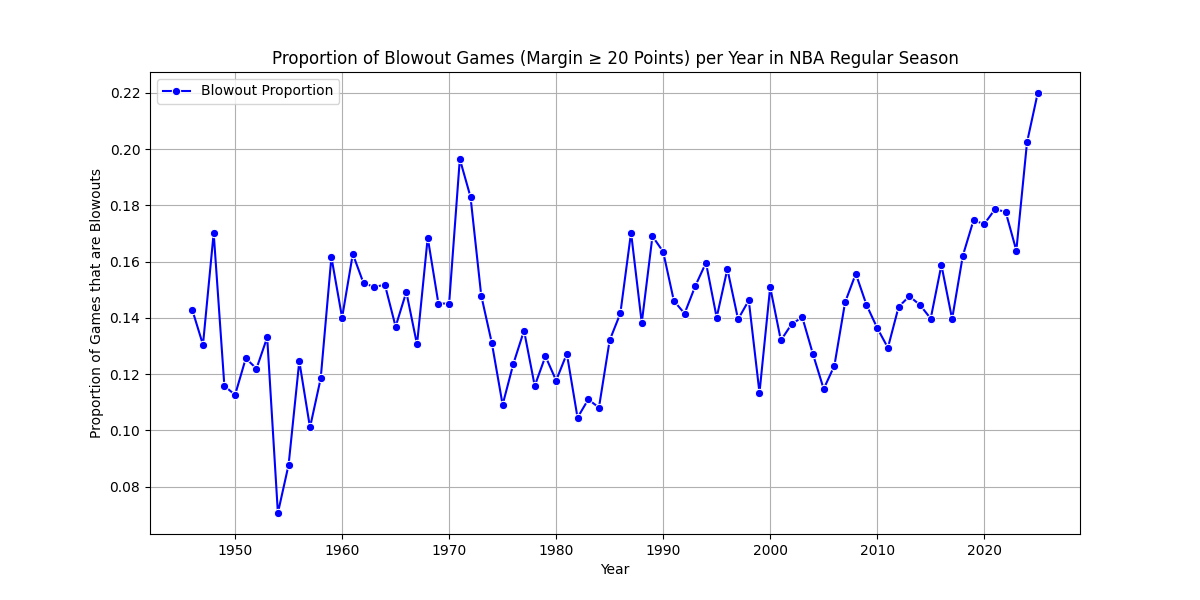
So, we filtered out all the regular season games and then plotted the data. We have the raw blowout data in the first image and then the proportions in the second plot below:
Code is here:
import pandas as pd
import matplotlib.pyplot as plt
import seaborn as sns

# Load the CSV file
df = pd.read_csv('games_data/Games.csv', low_memory=False)

# Convert gameDate to datetime
df['gameDate'] = pd.to_datetime(df['gameDate'])
df['year'] = df['gameDate'].dt.year

# Filter for regular season games (using gameType)
regular_season_df = df[df['gameType'] == 'Regular Season']

# Alternative: Filter using gameId if needed (uncomment if gameType is unreliable)
# regular_season_df = df[df['gameId'].astype(str).str.startswith('002')]

# Calculate margin of victory and identify blowouts in the filtered DataFrame
regular_season_df['margin'] = abs(regular_season_df['homeScore'] - regular_season_df['awayScore'])
regular_season_df['is_blowout'] = regular_season_df['margin'] >= 20

# Group by year and calculate blowouts and total games
blowout_summary = regular_season_df.groupby('year').agg(
    total_games=('gameId', 'count'),
    blowout_games=('is_blowout', 'sum')
).reset_index()

# Calculate proportion of blowouts
blowout_summary['blowout_proportion'] = blowout_summary['blowout_games'] / blowout_summary['total_games']

# Plot the number of blowouts over time
plt.figure(figsize=(12, 6))
sns.lineplot(data=blowout_summary, x='year', y='blowout_games', marker='o', label='Blowout Games', color="green")
plt.title('Number of Blowout Games (Margin ≥ 20 Points) per Year in NBA Regular Season')
plt.xlabel('Year')
plt.ylabel('Number of Blowout Games')
plt.grid(True)
plt.legend()
plt.show()

# Plot the proportion of blowouts
plt.figure(figsize=(12, 6))
sns.lineplot(data=blowout_summary, x='year', y='blowout_proportion', marker='o', color='blue', label='Blowout Proportion')
plt.title('Proportion of Blowout Games (Margin ≥ 20 Points) per Year in NBA Regular Season')
plt.xlabel('Year')
plt.ylabel('Proportion of Games that are Blowouts')
plt.grid(True)
plt.legend()
plt.show()
python data parsing data extraction data analysis NBA NBA Regular Season Statistics Web Scraping python for sports pandas seaborn data visualization scipy matplotlib numpy BeautifulSoup json csv kaggle kaggle datasets
270 Words
2025-06-29 00:05
Read other posts