11 minutes
We’ve Done Some NBA and WNBA Data Analysis … How About Some MLB?
Watching the LA Dodgers and SF Giants game yesterday—Saturday, June 14, 2025—the commentators were talking about Clayton Kershaw’s closing in a on 3000 career strikeouts. Having earlier watched Pittsburgh Pirates ace Paul Skenes go, I wonder if we could visualize the possibilities of the latter eventually clearing that line.
We can project Paul Skenes’s trajectory based on some estimates—whether we’re really optimistic in certain K numbers per game or pessimistic—and we get something like this:
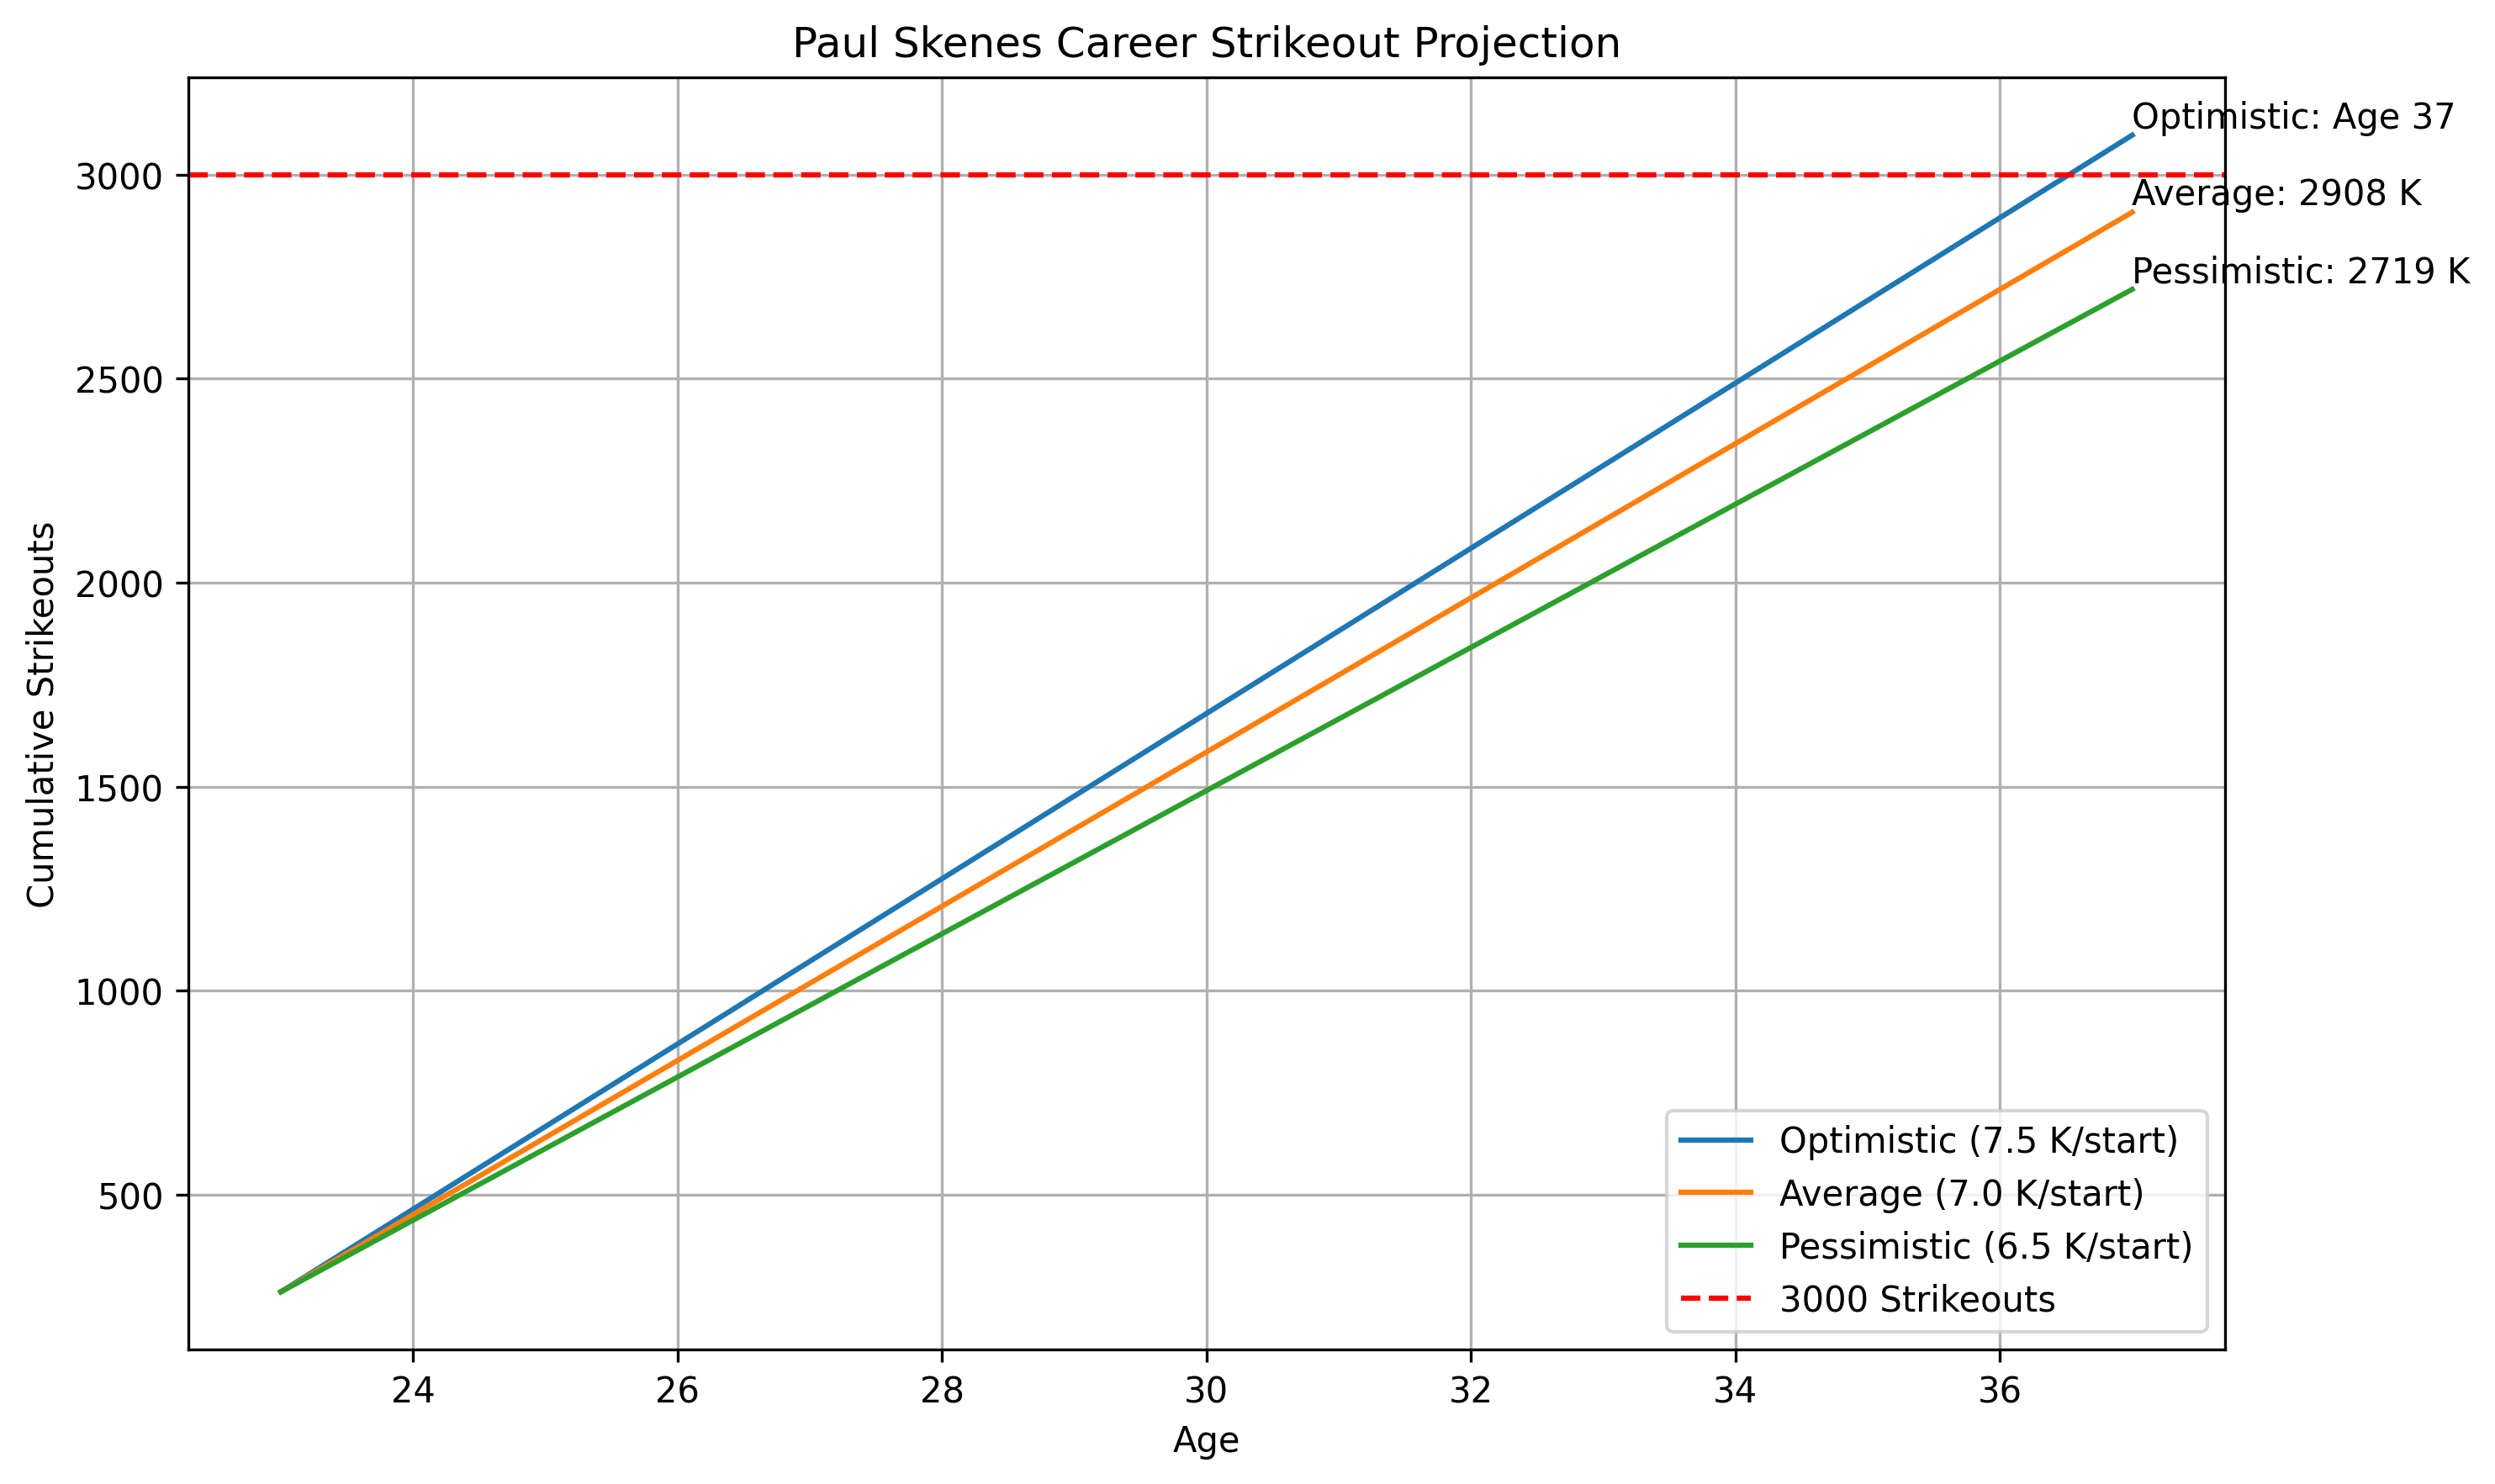
(Code for this is in Appendix 1 below.)
We can also look at Kershaw’s road to 3000 over his career:
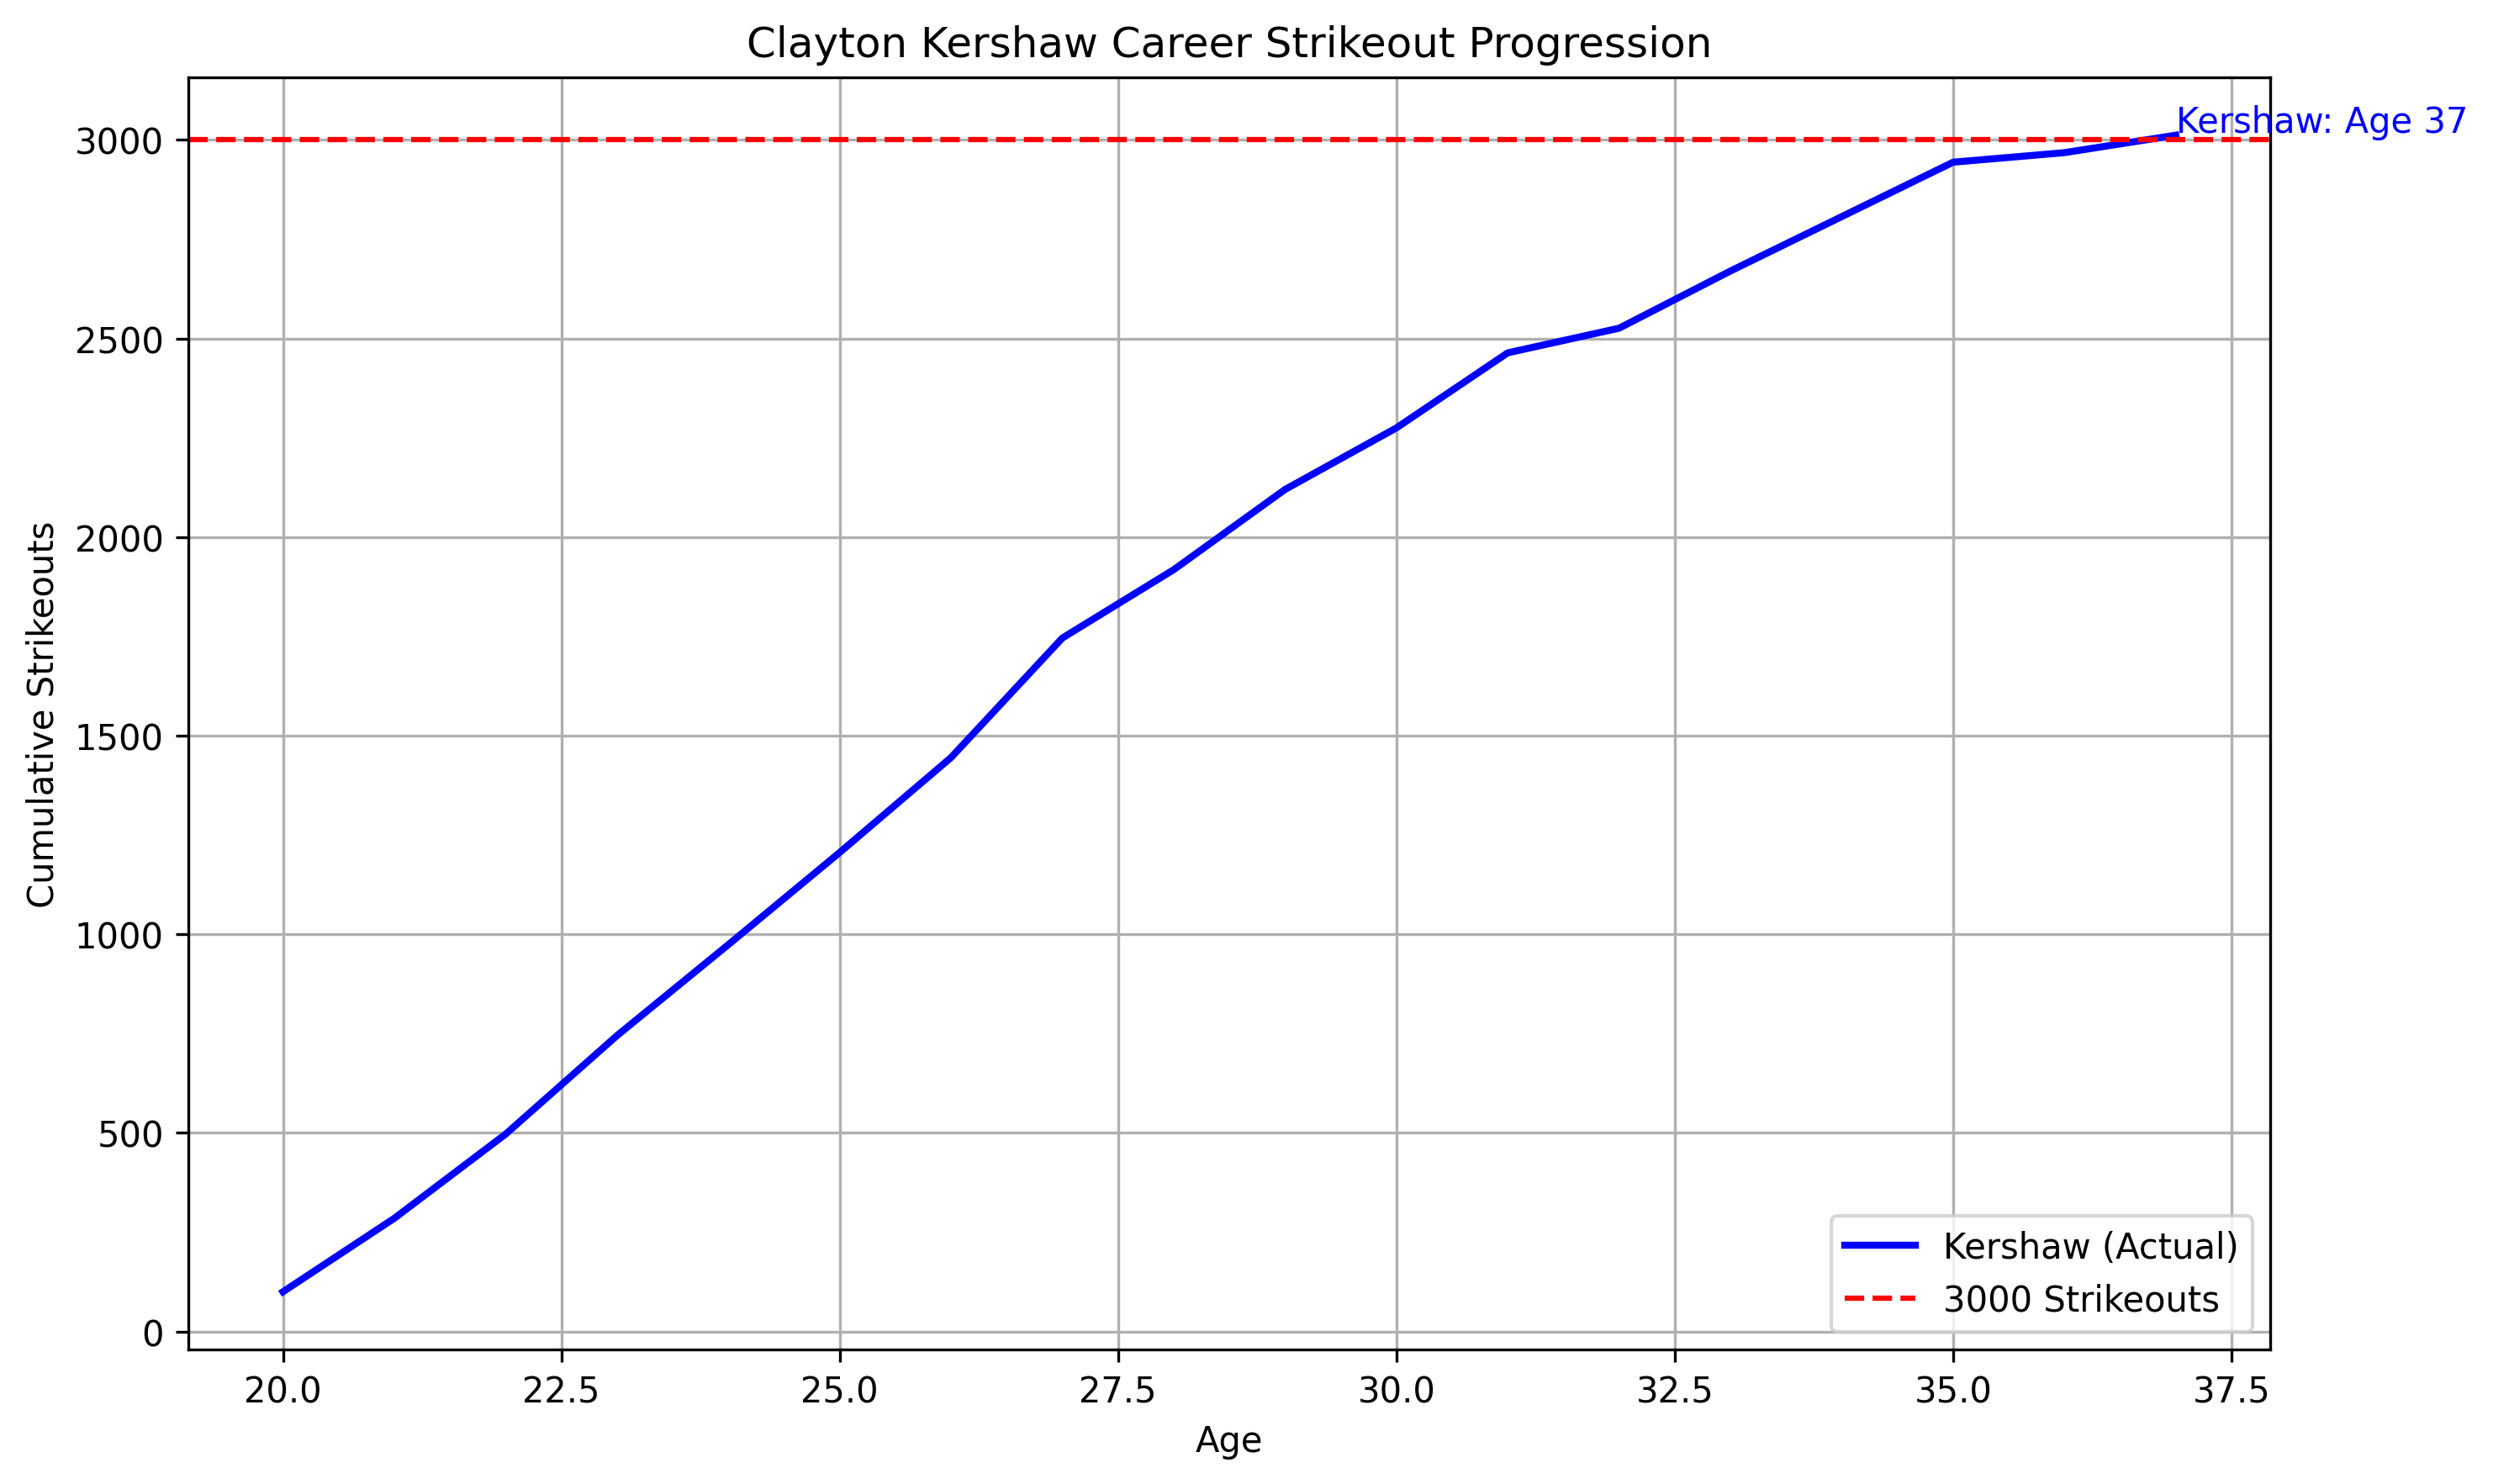
(Code for this is in Appendix 2 infra.)
Lastly, we could oveerlay them together:
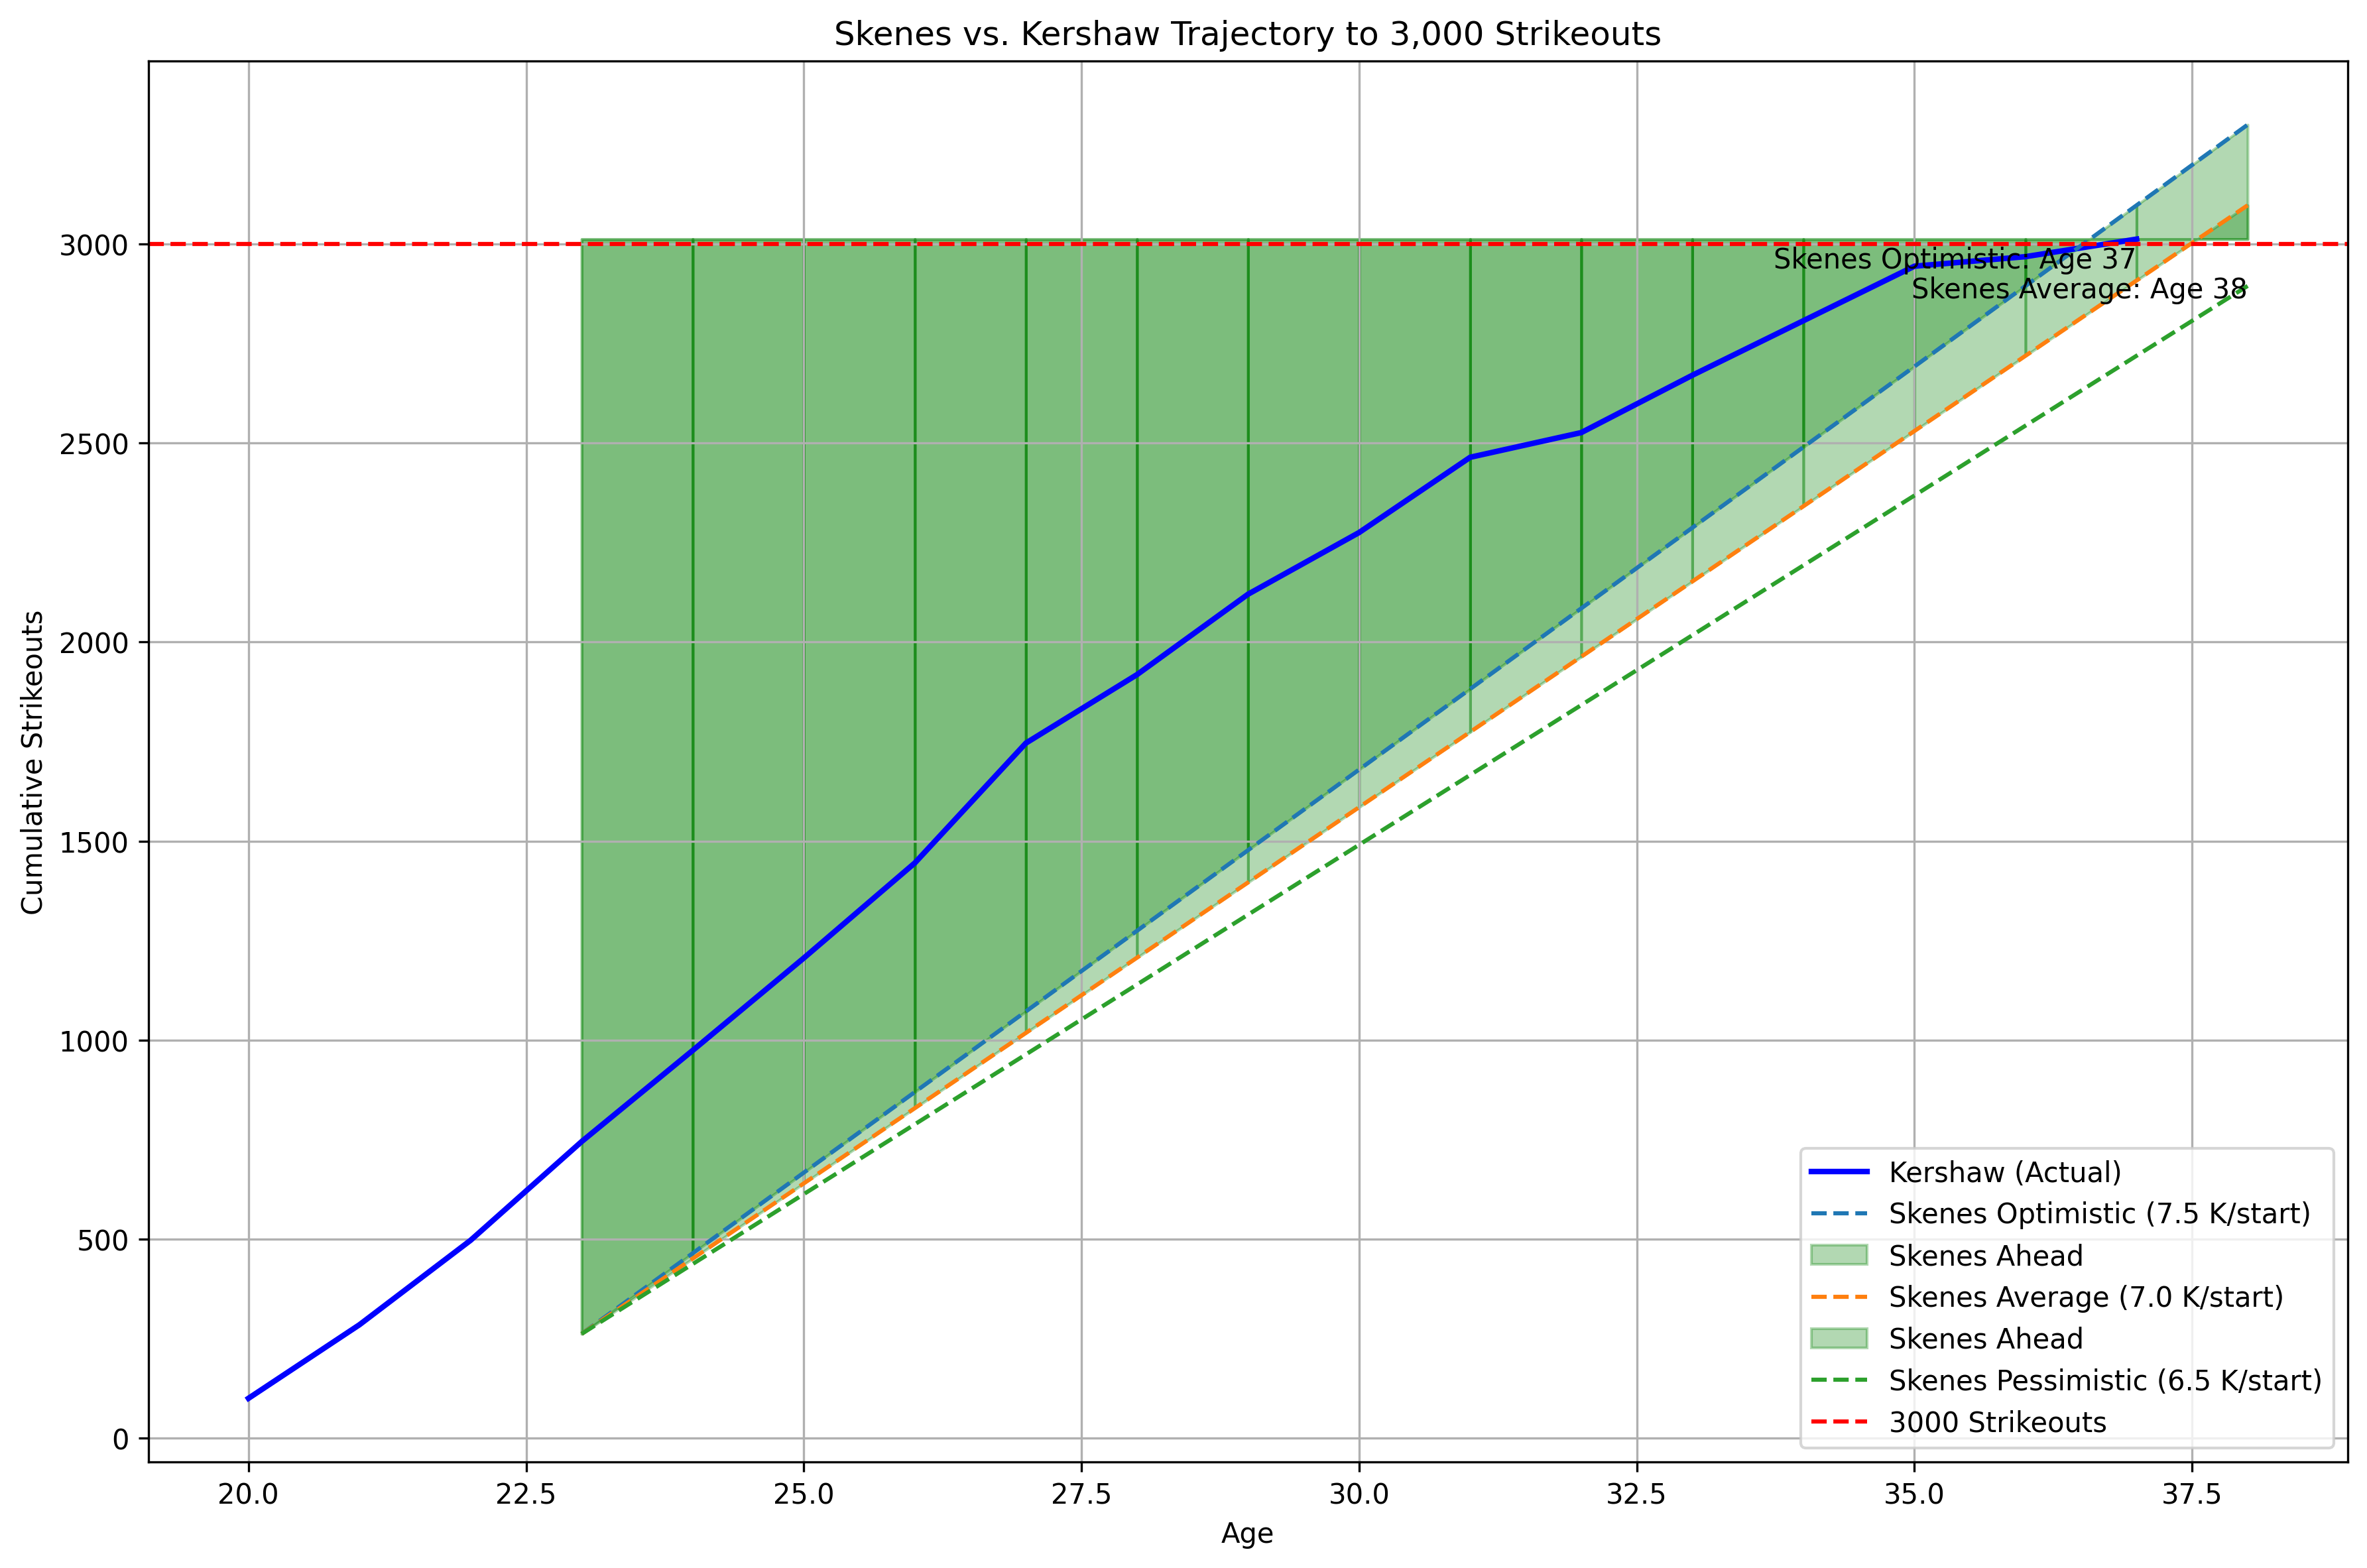
(Code is in Appendix 3.)
Appendix 1: Skenes’s Current Trajectory
import numpy as np
import pandas as pd
import matplotlib.pyplot as plt
import requests
from bs4 import BeautifulSoup
import time
import logging
import argparse
import os

# Set up logging
logging.basicConfig(level=logging.INFO, format='%(asctime)s - %(levelname)s - %(message)s')

# Function to scrape Paul Skenes' stats from FanGraphs or ESPN with retries
def get_skenes_stats(max_retries=3, delay=2):
    # Try FanGraphs first
    url_fangraphs = "https://www.fangraphs.com/players/paul-skenes/24615/stats?position=P"
    url_espn = "http://www.espn.com/mlb/player/stats/_/id/42922/paul-skenes"
    headers = {
        'User-Agent': 'Mozilla/5.0 (Macintosh; Intel Mac OS X 10_15_7) AppleWebKit/537.36 (KHTML, like Gecko) Chrome/91.0.4472.124 Safari/537.36',
        'Accept': 'text/html,application/xhtml+xml,application/xml;q=0.9,image/webp,*/*;q=0.8',
        'Accept-Language': 'en-US,en;q=0.5',
        'Referer': 'https://www.fangraphs.com/'
    }

    # Try FanGraphs
    for attempt in range(max_retries):
        try:
            response = requests.get(url_fangraphs, headers=headers, timeout=10)
            response.raise_for_status()
            soup = BeautifulSoup(response.text, 'html.parser')
            table = soup.find('table', id='PitchingStandard')
            if not table:
                raise ValueError("Pitching stats table not found")
            career_row = table.find_all('tr', class_=['rgRow', 'rgAltRow'])[-1]
            cells = career_row.find_all('td')
            strikeouts = int(cells[13].text.strip())  # SO column
            games_started = int(cells[5].text.strip())  # GS column
            logging.info(f"Successfully scraped stats from FanGraphs: {strikeouts} strikeouts, {games_started} starts")
            return strikeouts, games_started
        except Exception as e:
            logging.warning(f"FanGraphs attempt {attempt + 1} failed: {e}")
            if attempt < max_retries - 1:
                time.sleep(delay)

    # Try ESPN as fallback
    headers['Referer'] = 'http://www.espn.com/'
    for attempt in range(max_retries):
        try:
            response = requests.get(url_espn, headers=headers, timeout=10)
            response.raise_for_status()
            soup = BeautifulSoup(response.text, 'html.parser')
            stats_table = soup.find('table', class_='Table')
            if not stats_table:
                raise ValueError("Stats table not found on ESPN")
            career_row = stats_table.find('tr', class_='Table__TR--lg')
            cells = career_row.find_all('td')
            strikeouts = int(cells[13].text.strip())  # SO column
            games_started = int(cells[3].text.strip())  # GS column
            logging.info(f"Successfully scraped stats from ESPN: {strikeouts} strikeouts, {games_started} starts")
            return strikeouts, games_started
        except Exception as e:
            logging.warning(f"ESPN attempt {attempt + 1} failed: {e}")
            if attempt < max_retries - 1:
                time.sleep(delay)

    logging.error(f"Scraping failed after {max_retries} attempts on both sites. Using fallback data.")
    logging.warning("Consider using --manual or checking https://www.fangraphs.com/players/paul-skenes/24615/stats?position=P or http://www.espn.com/mlb/player/stats/_/id/42922/paul-skenes")
    return 262, 37  # Fallback: 262 strikeouts, 37 starts

# Function to get stats via manual input
def get_manual_stats():
    try:
        strikeouts = int(input("Enter Paul Skenes' current strikeouts: "))
        starts = int(input("Enter Paul Skenes' current starts: "))
        logging.info(f"Manually entered stats: {strikeouts} strikeouts, {starts} starts")
        return strikeouts, starts
    except ValueError:
        logging.error("Invalid input. Using fallback data.")
        return 262, 37

# Parse command-line arguments
parser = argparse.ArgumentParser(description="Project Paul Skenes' career strikeouts")
parser.add_argument('--manual', action='store_true', help='Manually input stats instead of scraping')
parser.add_argument('--no-scrape', action='store_true', help='Skip scraping and use fallback data')
parser.add_argument('--years', type=int, default=15, help='Number of projection years (default: 15)')
args = parser.parse_args()

# Get current stats
if args.manual:
    current_strikeouts, current_starts = get_manual_stats()
elif args.no_scrape:
    current_strikeouts, current_starts = 262, 37
    logging.info("Skipping scraping as per --no-scrape. Using fallback data: 262 strikeouts, 37 starts")
else:
    current_strikeouts, current_starts = get_skenes_stats()

current_age = 23  # As of June 14, 2025

# Assumptions
strikeouts_per_start = {'optimistic': 7.5, 'average': 7.0, 'pessimistic': 6.5}
starts_per_season = 27  # Average of 25-30 starts
career_years = np.arange(0, args.years)  # Projection years (default: 2025 to 2039)
seasons = current_age + career_years  # Corresponding ages
logging.info(f"Projecting for {len(career_years)} years, ages {current_age} to {seasons[-1]}")

# Function to project strikeouts
def project_strikeouts(strikeout_rate, starts_per_year, years, current_k):
    cumulative_k = [current_k]
    for i in range(1, len(years)):  # Start from second year (first is partial)
        season_k = strikeout_rate * starts_per_year
        cumulative_k.append(cumulative_k[-1] + season_k)
    return cumulative_k

# Calculate projections for each scenario
projections = {}
for scenario, k_rate in strikeouts_per_start.items():
    projections[scenario] = project_strikeouts(k_rate, starts_per_season, career_years, current_strikeouts)

# Create DataFrame for visualization
df = pd.DataFrame({
    'age': seasons,
    'optimistic': projections['optimistic'],
    'average': projections['average'],
    'pessimistic': projections['pessimistic']
})
logging.info(f"DataFrame created with columns: {df.columns.tolist()}")

# Save projections to CSV
csv_path = "/Users/spicy.kev/Documents/github/kspicer80.github.io/static/images/imgforblogposts/post_41/skenes_projections.csv"
try:
    df.to_csv(csv_path, index=False)
    logging.info(f"Projections saved to {csv_path}")
except Exception as e:
    logging.error(f"Failed to save CSV to {csv_path}: {e}")

# Find years to reach 3000 strikeouts
target_k = 3000
reach_3000 = {}
for scenario in projections:
    years_to_3000 = np.where(np.array(projections[scenario]) >= target_k)[0]
    if len(years_to_3000) > 0:
        year_idx = years_to_3000[0]
        reach_3000[scenario] = {'age': seasons[year_idx], 'strikeouts': projections[scenario][year_idx]}
    else:
        reach_3000[scenario] = {'age': None, 'strikeouts': projections[scenario][-1]}

# Plotting
plt.figure(figsize=(10, 6))
for scenario in projections:
    plt.plot(df['age'], df[scenario], label=f'{scenario.capitalize()} ({strikeouts_per_start[scenario]} K/start)')
plt.axhline(y=3000, color='r', linestyle='--', label='3000 Strikeouts')
plt.xlabel('Age')
plt.ylabel('Cumulative Strikeouts')
plt.title('Paul Skenes Career Strikeout Projection')
plt.legend()
plt.grid(True)

# Add text for when 3000 K is reached
for scenario, info in reach_3000.items():
    if info['age'] is not None:
        plt.text(info['age'], info['strikeouts'], f'{scenario.capitalize()}: Age {info["age"]}', verticalalignment='bottom')
    else:
        plt.text(df['age'].iloc[-1], info['strikeouts'], f'{scenario.capitalize()}: {int(info["strikeouts"])} K', verticalalignment='bottom')

plt.tight_layout()

# Save plot to specified path
save_path = "/Users/spicy.kev/Documents/github/kspicer80.github.io/static/images/imgforblogposts/post_41/skenes_projection.png"
try:
    os.makedirs(os.path.dirname(save_path), exist_ok=True)
    plt.savefig(save_path, dpi=300, bbox_inches='tight')
    logging.info(f"Plot saved to {save_path}")
except Exception as e:
    logging.error(f"Failed to save plot to {save_path}: {e}")

plt.show()

# Print results
print(f"Paul Skenes Current Stats: {current_strikeouts} strikeouts in {current_starts} starts")
print(f"Projecting for {len(career_years)} years (ages {current_age} to {seasons[-1]})")
print("Career Strikeout Projections:")
for scenario, info in reach_3000.items():
    if info['age'] is not None:
        print(f"{scenario.capitalize()} Scenario: Reaches 3000 strikeouts at age {info['age']} with {int(info['strikeouts'])} strikeouts")
    else:
        print(f"{scenario.capitalize()} Scenario: Ends at {int(info['strikeouts'])} strikeouts by age {df['age'].iloc[-1]}")
Appendix 2: Plotting Kershaw’s Journey to 3000
import numpy as np
import pandas as pd
import matplotlib.pyplot as plt
import os
import logging

# Set up logging
logging.basicConfig(level=logging.INFO, format='%(asctime)s - %(levelname)s - %(message)s')

# Fallback data for Kershaw (2008–2025 partial)
kershaw_fallback = {
    'year': [2008, 2009, 2010, 2011, 2012, 2013, 2014, 2015, 2016, 2017, 2018, 2019, 2020, 2021, 2022, 2023, 2024, 2025],
    'age': [20, 21, 22, 23, 24, 25, 26, 27, 28, 29, 30, 31, 32, 33, 34, 35, 36, 37],
    'strikeouts': [100, 185, 212, 248, 229, 232, 239, 301, 172, 202, 155, 189, 62, 144, 137, 137, 24, 44]
}

# Get Kershaw's stats
def get_kershaw_stats():
    # Prompt for manual input
    use_manual = input("Use manual input for Kershaw's 2025 strikeouts? (y/n, default n): ").strip().lower()
    if use_manual == 'y':
        try:
            strikeouts_2025_total = int(input("Enter Kershaw's 2025 strikeouts (total career): "))
            years = kershaw_fallback['year'][:-1] + [2025]
            ages = kershaw_fallback['age'][:-1] + [37]
            prior_total = sum(kershaw_fallback['strikeouts'][:-1])  # Sum up to 2024 (2,944)
            if strikeouts_2025_total < prior_total:
                raise ValueError("Total strikeouts cannot be less than prior total.")
            strikeouts_2025 = strikeouts_2025_total - prior_total  # Incremental strikeouts for 2025
            strikeouts_list = kershaw_fallback['strikeouts'][:-1] + [max(0, strikeouts_2025)]  # Ensure non-negative
            logging.info(f"Using manual input: Total {strikeouts_2025_total} strikeouts, 2025 increment {strikeouts_2025}")
            return years, ages, strikeouts_list
        except ValueError as e:
            logging.error(f"Invalid input: {e}. Using fallback data.")

    # Use fallback data
    total_strikeouts = sum(kershaw_fallback['strikeouts'])
    logging.info(f"Using fallback data for Kershaw: {total_strikeouts} strikeouts")
    return kershaw_fallback['year'], kershaw_fallback['age'], kershaw_fallback['strikeouts']

# Get Kershaw's data
kershaw_years, kershaw_ages, kershaw_strikeouts_list = get_kershaw_stats()
logging.info(f"Strikeout list: {kershaw_strikeouts_list}")
kershaw_strikeouts = sum(kershaw_strikeouts_list)  # Total career strikeouts
logging.info(f"Calculated total strikeouts: {kershaw_strikeouts} at age {kershaw_ages[-1]}")

# Calculate cumulative strikeouts
kershaw_cumulative = np.cumsum(kershaw_strikeouts_list)
logging.info(f"Cumulative strikeouts: {kershaw_cumulative}")

# Create DataFrame
df_kershaw = pd.DataFrame({
    'age': kershaw_ages,
    'strikeouts': kershaw_cumulative
})
logging.info(f"Kershaw DataFrame: {len(df_kershaw)} rows")

# Save data to CSV
csv_path = "/Users/spicy.kev/Documents/github/kspicer80.github.io/static/images/imgforblogposts/post_41/kershaw_strikeouts.csv"
try:
    df_kershaw.to_csv(csv_path, index=False)
    logging.info(f"Data saved to {csv_path}")
except Exception as e:
    logging.error(f"Failed to save CSV to {csv_path}: {e}")

# Find age to reach 3000 strikeouts (minimal projection if needed)
target_k = 3000
kershaw_3000_age = None
if kershaw_cumulative[-1] < target_k:
    remaining_k = target_k - kershaw_cumulative[-1]
    seasons_needed = np.ceil(remaining_k / (7 * 27))  # 7 K/start, 27 starts/season
    if seasons_needed > 0 and seasons_needed <= 5:  # Limit projection to 5 years for realism
        additional_ages = [kershaw_ages[-1] + i for i in range(1, int(seasons_needed) + 1)]
        additional_strikeouts = [kershaw_cumulative[-1] + i * (7 * 27) for i in range(1, int(seasons_needed) + 1)]
        df_kershaw = pd.concat([
            df_kershaw,
            pd.DataFrame({'age': additional_ages, 'strikeouts': additional_strikeouts})
        ], ignore_index=True)
        kershaw_3000_age = df_kershaw['age'][np.where(df_kershaw['strikeouts'] >= target_k)[0][0]]
elif kershaw_cumulative[-1] >= target_k:
    kershaw_3000_age = df_kershaw['age'][np.where(kershaw_cumulative >= target_k)[0][0]]

# Plotting
plt.figure(figsize=(10, 6))
plt.plot(df_kershaw['age'], df_kershaw['strikeouts'], label='Kershaw (Actual)', color='blue', linewidth=2)
plt.axhline(y=3000, color='r', linestyle='--', label='3000 Strikeouts')
plt.xlabel('Age')
plt.ylabel('Cumulative Strikeouts')
plt.title('Clayton Kershaw Career Strikeout Progression')
plt.legend()
plt.grid(True)

# Add text for 3000 K milestone
if kershaw_3000_age and kershaw_3000_age > kershaw_ages[-1]:
    plt.text(kershaw_3000_age, target_k, f'Kershaw: Age {int(kershaw_3000_age)}', verticalalignment='bottom', color='blue')
elif kershaw_3000_age:
    plt.text(kershaw_3000_age, target_k, f'Kershaw: Age {int(kershaw_3000_age)}', verticalalignment='bottom', color='blue')
else:
    plt.text(df_kershaw['age'].iloc[-1], kershaw_cumulative[-1], f'Kershaw: {int(kershaw_cumulative[-1])} K', verticalalignment='bottom')

plt.tight_layout()

# Save plot
save_path = "/Users/spicy.kev/Documents/github/kspicer80.github.io/static/images/imgforblogposts/post_41/kershaw_strikeouts.png"
try:
    os.makedirs(os.path.dirname(save_path), exist_ok=True)
    plt.savefig(save_path, dpi=300, bbox_inches='tight')
    logging.info(f"Plot saved to {save_path}")
except Exception as e:
    logging.error(f"Failed to save plot to {save_path}: {e}")

plt.show()

# Print results
print(f"Clayton Kershaw Current Stats: {kershaw_strikeouts} strikeouts (age {kershaw_ages[-1]})")
print("3,000 Strikeout Projection:")
if kershaw_3000_age and kershaw_3000_age > kershaw_ages[-1]:
    print(f"Kershaw: Reaches 3000 strikeouts at age {int(kershaw_3000_age)}")
elif kershaw_3000_age:
    print(f"Kershaw: Reached 3000 strikeouts at age {int(kershaw_3000_age)}")
else:
    print(f"Kershaw: Ends at {kershaw_strikeouts} strikeouts by age {kershaw_ages[-1]}, needs {target_k - kershaw_strikeouts} more")
Appendix 3: Comparing the Two
import numpy as np
import pandas as pd
import matplotlib.pyplot as plt
import os
import logging

# Set up logging
logging.basicConfig(level=logging.INFO, format='%(asctime)s - %(levelname)s - %(message)s')

# Define strikeouts per start globally
strikeouts_per_start = {'optimistic': 7.5, 'average': 7.0, 'pessimistic': 6.5}

# Fallback data for Kershaw (2008–2025 partial)
kershaw_fallback = {
    'year': [2008, 2009, 2010, 2011, 2012, 2013, 2014, 2015, 2016, 2017, 2018, 2019, 2020, 2021, 2022, 2023, 2024, 2025],
    'age': [20, 21, 22, 23, 24, 25, 26, 27, 28, 29, 30, 31, 32, 33, 34, 35, 36, 37],
    'strikeouts': [100, 185, 212, 248, 229, 232, 239, 301, 172, 202, 155, 189, 62, 144, 137, 137, 24, 44]  # Sum = 2,988
}

# Get Kershaw's stats
def get_kershaw_stats():
    use_manual = input("Use manual input for Kershaw's 2025 strikeouts? (y/n, default n): ").strip().lower()
    if use_manual == 'y':
        try:
            strikeouts_2025_total = int(input("Enter Kershaw's 2025 strikeouts (total career): "))
            years = kershaw_fallback['year'][:-1] + [2025]
            ages = kershaw_fallback['age'][:-1] + [37]
            prior_total = sum(kershaw_fallback['strikeouts'][:-1])  # 2,944 up to 2024
            if strikeouts_2025_total < prior_total:
                raise ValueError("Total strikeouts cannot be less than prior total.")
            strikeouts_2025 = strikeouts_2025_total - prior_total
            strikeouts_list = kershaw_fallback['strikeouts'][:-1] + [max(0, strikeouts_2025)]
            logging.info(f"Using manual input: Total {strikeouts_2025_total} strikeouts, 2025 increment {strikeouts_2025}")
            return years, ages, strikeouts_list
        except ValueError as e:
            logging.error(f"Invalid input: {e}. Using fallback data.")
    total_strikeouts = sum(kershaw_fallback['strikeouts'])  # Should be 2,988
    logging.info(f"Using fallback data for Kershaw: Strikeouts list {kershaw_fallback['strikeouts']}, Total {total_strikeouts} strikeouts")
    return kershaw_fallback['year'], kershaw_fallback['age'], kershaw_fallback['strikeouts']

# Get Skenes' projection
def get_skenes_projection():
    current_age = 23  # As of June 15, 2025
    current_strikeouts = 262  # Fallback from previous script
    current_starts = 37
    projection_years = 15
    starts_per_season = 27

    ages = [current_age + i for i in range(projection_years + 1)]
    projections = {}
    for scenario, k_rate in strikeouts_per_start.items():
        cumulative = [current_strikeouts]
        for i in range(1, projection_years + 1):
            season_k = k_rate * starts_per_season
            cumulative.append(cumulative[-1] + season_k)
        projections[scenario] = cumulative
    logging.info(f"Using fallback data for Skenes: {current_strikeouts} strikeouts, {current_starts} starts")
    return ages, projections

# Get data
kershaw_years, kershaw_ages, kershaw_strikeouts_list = get_kershaw_stats()
kershaw_cumulative = np.cumsum(kershaw_strikeouts_list)
df_kershaw = pd.DataFrame({'age': kershaw_ages, 'strikeouts': kershaw_cumulative})

skenes_ages, skenes_projections = get_skenes_projection()
df_skenes = pd.DataFrame({'age': skenes_ages})
for scenario, projection in skenes_projections.items():
    df_skenes[f'skenes_{scenario}'] = projection

# Combine DataFrames for analysis
df_combined = df_kershaw.rename(columns={'strikeouts': 'kershaw'}).copy()
for scenario in skenes_projections:
    df_combined = df_combined.merge(df_skenes[['age', f'skenes_{scenario}']], on='age', how='outer')
df_combined = df_combined.ffill().fillna(0)

# Find where Skenes is ahead or behind Kershaw
df_comparison = df_combined.copy()
for scenario in skenes_projections:
    df_comparison[f'diff_{scenario}'] = df_comparison[f'skenes_{scenario}'] - df_comparison['kershaw']
    df_comparison[f'ahead_{scenario}'] = df_comparison[f'diff_{scenario}'] > 0

# Save combined data to CSV
csv_path = "/Users/spicy.kev/Documents/github/kspicer80.github.io/static/images/imgforblogposts/post_41/skenes_vs_kershaw_trajectory.csv"
try:
    df_comparison.to_csv(csv_path, index=False)
    logging.info(f"Combined data saved to {csv_path}")
except Exception as e:
    logging.error(f"Failed to save CSV to {csv_path}: {e}")

# Plotting
plt.figure(figsize=(12, 8))
plt.plot(df_kershaw['age'], df_kershaw['strikeouts'], label='Kershaw (Actual)', color='blue', linewidth=2)
for scenario in skenes_projections:
    plt.plot(df_skenes['age'], df_skenes[f'skenes_{scenario}'], label=f'Skenes {scenario.capitalize()} ({strikeouts_per_start[scenario]} K/start)', linestyle='--')
    # Shade areas where Skenes is ahead
    ahead_mask = df_comparison[f'ahead_{scenario}'].reindex(df_skenes['age'], method='ffill').fillna(False)
    for i in range(len(df_skenes['age']) - 1):
        if ahead_mask.iloc[i]:
            plt.fill_between(df_skenes['age'][i:i+2], df_kershaw['strikeouts'].reindex(df_skenes['age'], method='ffill').iloc[i:i+2],
                           df_skenes[f'skenes_{scenario}'].iloc[i:i+2], color='green', alpha=0.3, label='Skenes Ahead' if i == 0 else "")
plt.axhline(y=3000, color='r', linestyle='--', label='3000 Strikeouts')
plt.xlabel('Age')
plt.ylabel('Cumulative Strikeouts')
plt.title('Skenes vs. Kershaw Trajectory to 3,000 Strikeouts')
plt.legend()
plt.grid(True)

# Annotate key milestones with offsets to reduce overlap
offset = 0
if df_kershaw['strikeouts'].iloc[-1] < 3000:
    remaining_k = 3000 - df_kershaw['strikeouts'].iloc[-1]
    seasons_needed = np.ceil(remaining_k / (7 * 27))
    if seasons_needed > 0 and seasons_needed <= 5:
        projected_age = 37 + seasons_needed
        plt.text(projected_age, 3000 + offset, f'Kershaw: Age {int(projected_age)}', verticalalignment='bottom', horizontalalignment='right', color='blue')
        offset -= 75  # Increased offset to 75 for more separation
for scenario, info in [('optimistic', skenes_projections['optimistic']), ('average', skenes_projections['average']), ('pessimistic', skenes_projections['pessimistic'])]:
    age_3000 = next((age for age, k in zip(skenes_ages, info) if k >= 3000), None)
    if age_3000:
        offset -= 75  # Increased offset to 75 for more separation
        plt.text(age_3000, 3000 + offset, f'Skenes {scenario.capitalize()}: Age {int(age_3000)}', verticalalignment='bottom', horizontalalignment='right')

plt.tight_layout()

# Save plot
save_path = "/Users/spicy.kev/Documents/github/kspicer80.github.io/static/images/imgforblogposts/post_41/skenes_vs_kershaw_trajectory.png"
try:
    os.makedirs(os.path.dirname(save_path), exist_ok=True)
    plt.savefig(save_path, dpi=300, bbox_inches='tight')
    logging.info(f"Plot saved to {save_path}")
except Exception as e:
    logging.error(f"Failed to save plot to {save_path}: {e}")

plt.show()

# Print results
print(f"Clayton Kershaw Current Stats: {int(df_kershaw['strikeouts'].iloc[-1])} strikeouts (age {int(kershaw_ages[-1])})")
print(f"Paul Skenes Current Stats: {current_strikeouts} strikeouts in {current_starts} starts (age {current_age})")
print(f"Projecting Skenes for {projection_years} years (ages {current_age} to {skenes_ages[-1]})")
print("Trajectory Insights:")
if df_kershaw['strikeouts'].iloc[-1] < 3000:
    print(f"Kershaw: Ends at {int(df_kershaw['strikeouts'].iloc[-1])} strikeouts by age {int(kershaw_ages[-1])}, needs {3000 - int(df_kershaw['strikeouts'].iloc[-1])} more")
    projected_age = 37 + np.ceil((3000 - df_kershaw['strikeouts'].iloc[-1]) / (7 * 27))
    print(f"Kershaw Projection: Reaches 3000 strikeouts at age {int(projected_age)}")
for scenario in skenes_projections:
    age_3000 = next((age for age, k in zip(skenes_ages, skenes_projections[scenario]) if k >= 3000), skenes_ages[-1])
    print(f"Skenes {scenario.capitalize()} Scenario: Reaches 3000 strikeouts at age {int(age_3000)} with {int(next(k for k in skenes_projections[scenario] if k >= 3000) if age_3000 != skenes_ages[-1] else skenes_projections[scenario][-1])} strikeouts")
python data parsing data extraction data analysis MLB Baseball MLB Pitchers Web Scraping python for sports pandas seaborn data visualization scipy matplotlib numpy BeautifulSoup json Paul Skenes Clayton Kershaw
2172 Words
2025-06-15 23:50