12 minutes
WNBA Historical Stats
Yay! The WNBA season is upon us and already started! Since I had recently done some analysis on the NBA Playoffs—I figured I would goof around and play with the WNBA a little bit. In service of that, let’s dive in.
So, as always, we start with data gathering. I tried using the fabulous nba_api to grab data, but for years closer to the creation of the league (1997), things seemed a little spotty to me. Then I came across a Kaggle dataset that had everything I needed from 1997 until 2020 (later I would fine some others that take it much closer to 2024, but that was after I had already written up the code.)
This dataset was nice as it offered a “features_informations.pdf” that gives us explanations of all the column names in the .csv. As I say, very nice.
So then I wrote some code to take the 1997-2020 and update it all the way up to 2024 using the nba_api. I’ll put that in Appendix 1 below. Thus we had all the team data from the very creation of the league all the way up until last year. With that, we could do some plotting. I figured we would try some visualizations of the total points, rebounds, assists, and three pointers made in each season of the WNBA (this code is in Appendix 2 below):
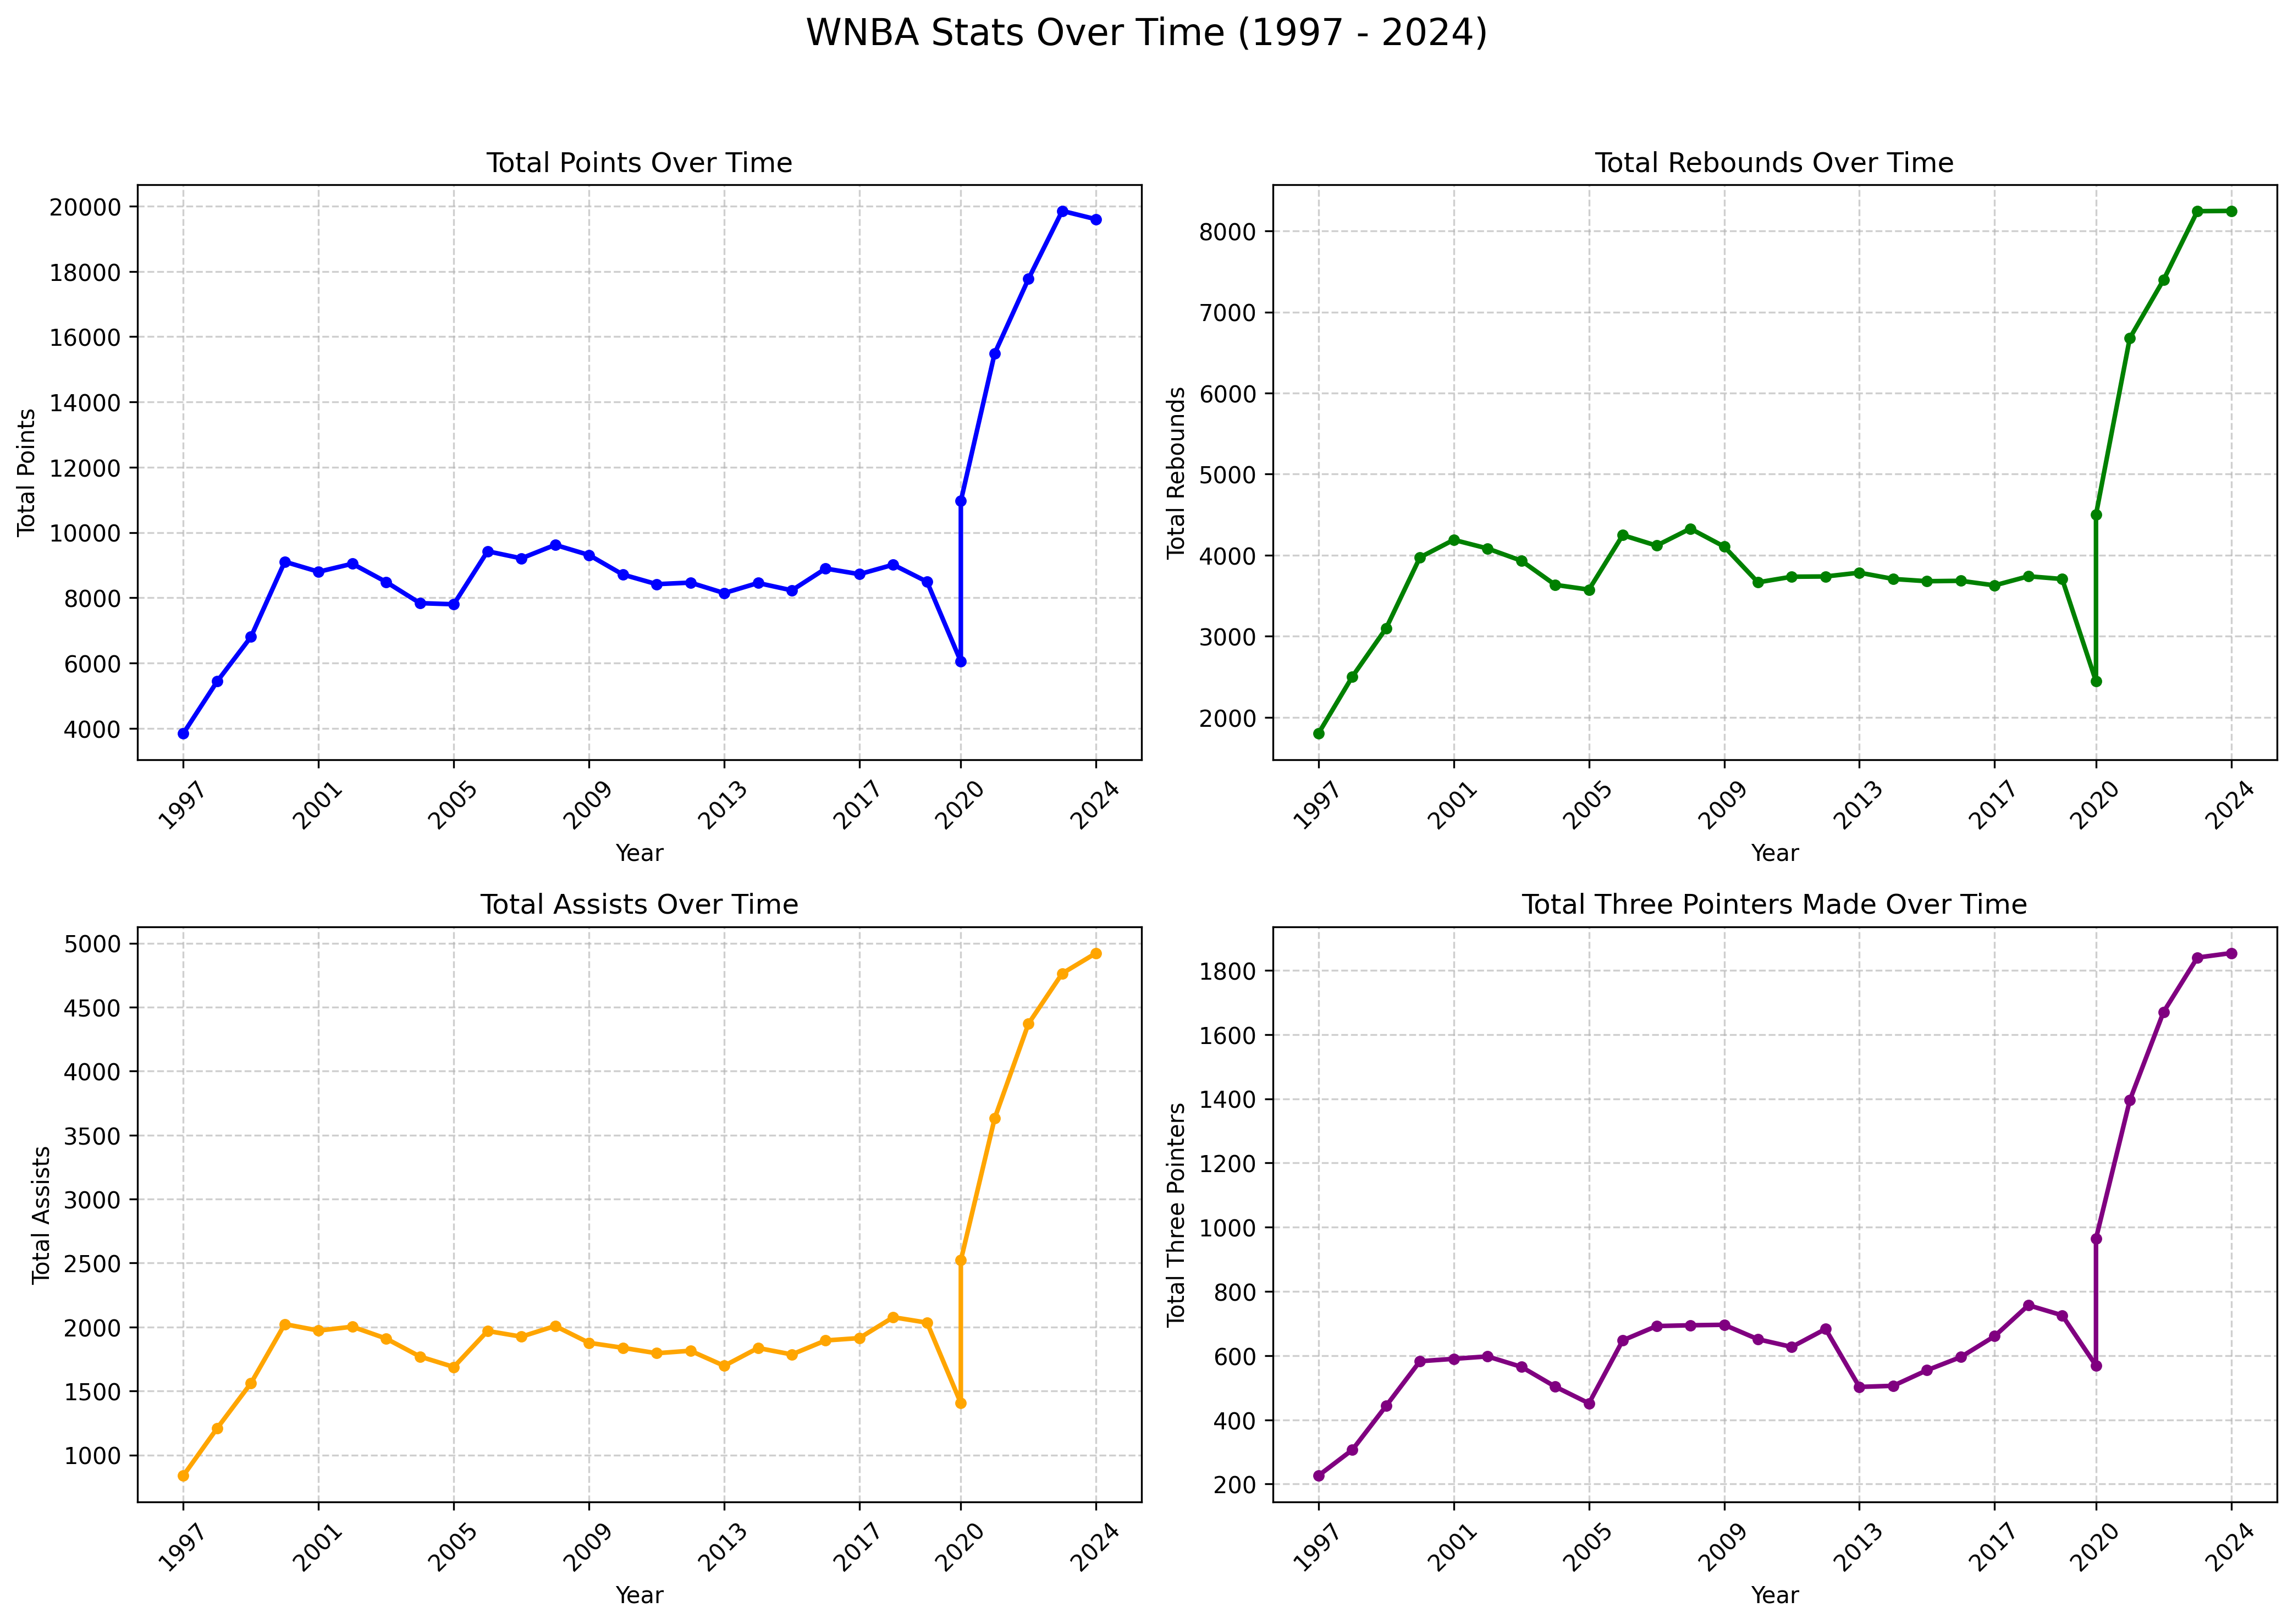
Obviousy a steady increase in all the stat categories—along with the dip in the COVID year as the WNBA only played half the number of normal games as usual.
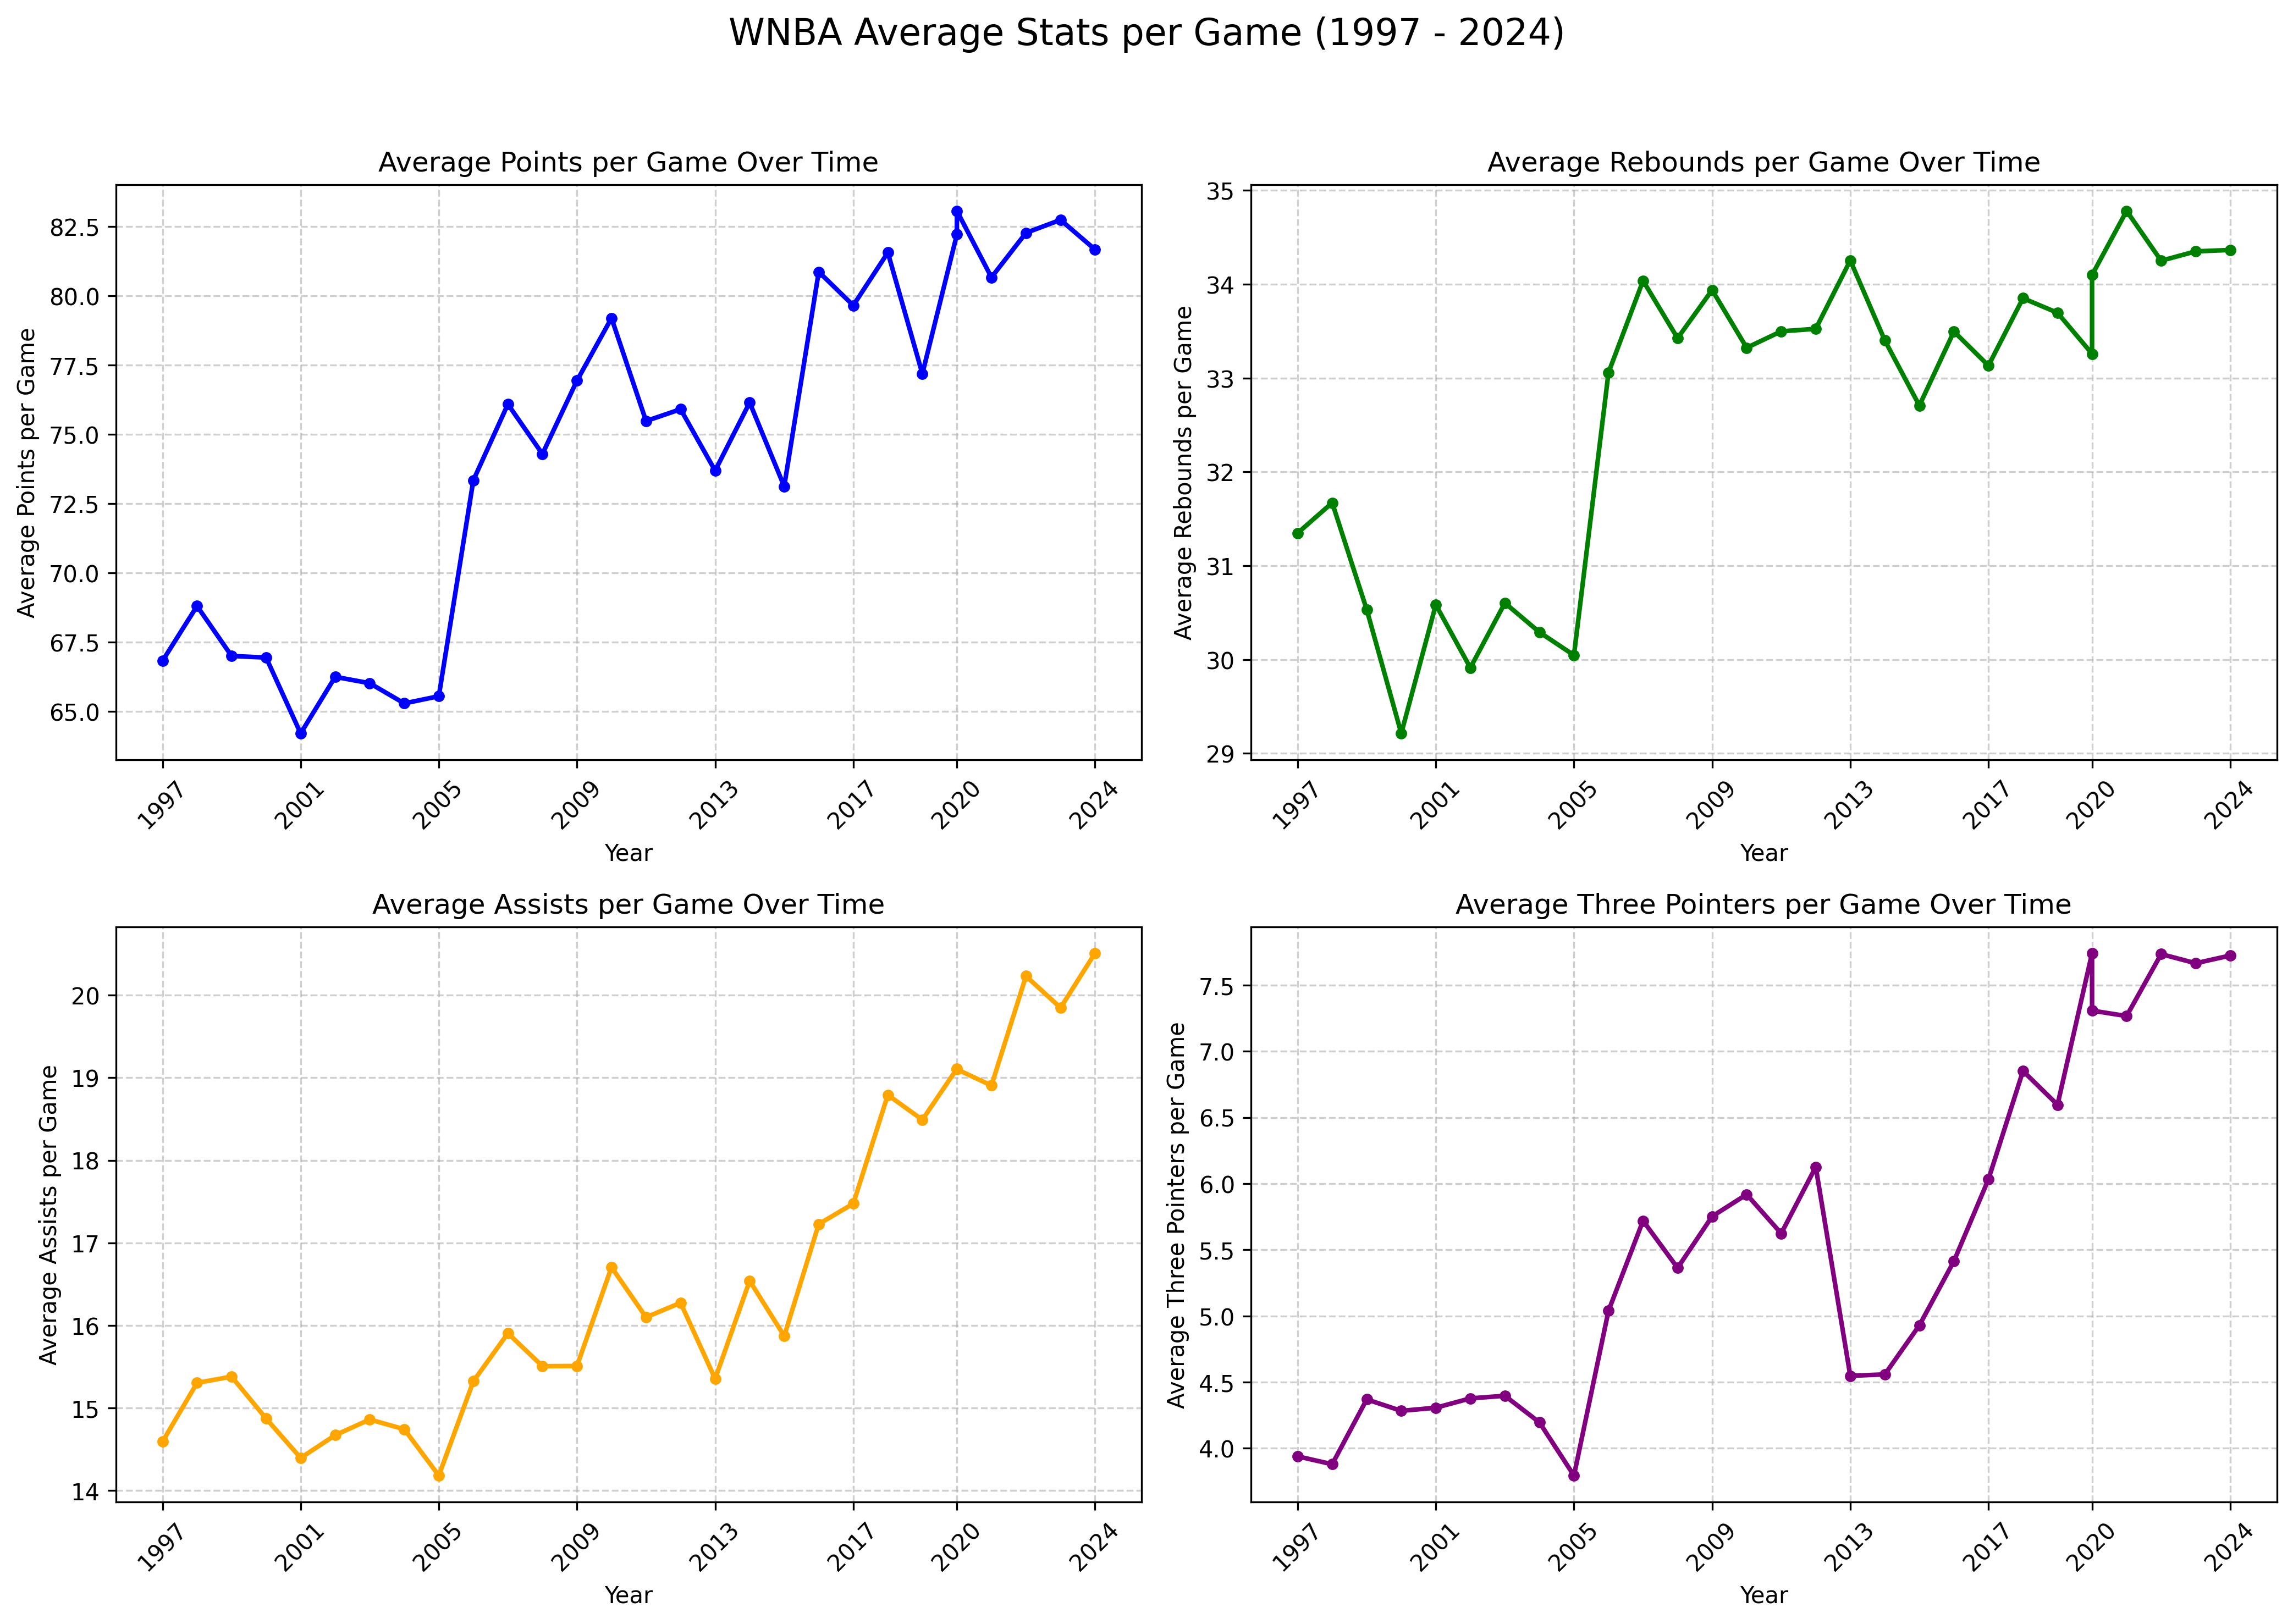
We can even take a look at averages of these categories per game today—again, nice upward trend with a dip in 2020:
As I say, just messing around—still more to be done and more to come here. Long story short: Welcome back WNBA basketball, I love it!!
Appendix 1: Updating Stats .csv file
import pandas as pd
import numpy as np
from nba_api.stats.endpoints import leaguegamelog
from datetime import datetime
import time

# --- Configuration ---
ORIGINAL_CSV = "1997-2020_officialBoxScore.csv"
UPDATED_CSV = "1997-2024_officialBoxScore.csv"
START_YEAR = 2020
END_YEAR = 2024

# Load the existing dataset
print(f"Loading existing dataset: {ORIGINAL_CSV}")
df_existing = pd.read_csv(ORIGINAL_CSV)

# List to store new game data
new_games = []

print(f"Fetching WNBA data from {START_YEAR} to {END_YEAR} using nba_api...")
for year in range(START_YEAR, END_YEAR + 1):
    season_str = f"{year}-{str(year+1)[2:]}"
    print(f"Fetching data for season: {season_str}")

    try:
        # Fetch league game log for the season
        game_logs = leaguegamelog.LeagueGameLog(
            league_id='10',  # WNBA League ID
            season=season_str,
            season_type_all_star='Regular Season'
        ).get_data_frames()[0]

        if game_logs.empty:
            print(f"No game log data found for {season_str}.")
            continue

        # Debug: Print available columns
        print(f"Available columns for {season_str}: {game_logs.columns.tolist()}")

        # Group by game_id to process each game
        games = game_logs.groupby('GAME_ID')
        for game_id, game_data in games:
            # Each game should have two teams
            if len(game_data) != 2:
                print(f"Skipping game {game_id}: Expected 2 teams, found {len(game_data)}")
                continue

            team1_data = game_data.iloc[0]
            team2_data = game_data.iloc[1]

            # Determine home and away teams (approximate based on MATCHUP)
            if 'MATCHUP' in team1_data and '@' in team1_data['MATCHUP']:
                away_team = team1_data
                home_team = team2_data
            else:
                home_team = team1_data
                away_team = team2_data

            # Game date
            game_date = pd.to_datetime(team1_data['GAME_DATE']).strftime('%Y-%m-%d')

            # Determine winner
            home_points = home_team['PTS']
            away_points = away_team['PTS']
            if home_points > away_points:
                home_result = 'Win'
                away_result = 'Loss'
                winner = home_team['TEAM_ABBREVIATION']
            else:
                home_result = 'Loss'
                away_result = 'Win'
                winner = away_team['TEAM_ABBREVIATION']

            # Calculate team possessions (simplified)
            def calculate_possessions(fga, to, fta):
                return fga + to + 0.4 * fta  # Simplified approximation

            # Map data to features for both teams
            for team_data, loc, rslt, oppt_data in [
                (home_team, 'Home', home_result, away_team),
                (away_team, 'Away', away_result, home_team)
            ]:
                fga = team_data['FGA']
                fgm = team_data['FGM']
                fg_pct = (fgm / fga * 100) if fga > 0 else 0
                two_pa = team_data['FGA'] - team_data.get('FG3A', 0)
                two_pm = two_pa - (team_data.get('FG3A', 0) - team_data.get('FG3M', 0))
                two_p_pct = (two_pm / two_pa * 100) if two_pa > 0 else 0
                three_pa = team_data.get('FG3A', 0)
                three_pm = team_data.get('FG3M', 0)
                three_p_pct = (three_pm / three_pa * 100) if three_pa > 0 else 0
                fta = team_data['FTA']
                ftm = team_data['FTM']
                ft_pct = (ftm / fta * 100) if fta > 0 else 0
                orb = team_data.get('OREB', 0)
                drb = team_data.get('DREB', 0)
                trb = orb + drb
                to = team_data.get('TO', 0)  # Use 'TO' instead of 'TURNOVERS'
                ast = team_data['AST']
                stl = team_data['STL']
                blk = team_data['BLK']
                pf = team_data['PF']
                pts = team_data['PTS']
                min_played = 240  # Approximate as 48 minutes * 5 players

                # Opponent stats
                oppt_fga = oppt_data['FGA']
                oppt_fgm = oppt_data['FGM']
                oppt_fg_pct = (oppt_fgm / oppt_fga * 100) if oppt_fga > 0 else 0
                oppt_two_pa = oppt_fga - oppt_data.get('FG3A', 0)
                oppt_two_pm = oppt_two_pa - (oppt_data.get('FG3A', 0) - oppt_data.get('FG3M', 0))
                oppt_two_p_pct = (oppt_two_pm / oppt_two_pa * 100) if oppt_two_pa > 0 else 0
                oppt_three_pa = oppt_data.get('FG3A', 0)
                oppt_three_pm = oppt_data.get('FG3M', 0)
                oppt_three_p_pct = (oppt_three_pm / oppt_three_pa * 100) if oppt_three_pa > 0 else 0
                oppt_fta = oppt_data['FTA']
                oppt_ftm = oppt_data['FTM']
                oppt_ft_pct = (oppt_ftm / oppt_fta * 100) if oppt_fta > 0 else 0
                oppt_orb = oppt_data.get('OREB', 0)
                oppt_drb = oppt_data.get('DREB', 0)
                oppt_trb = oppt_orb + oppt_drb
                oppt_to = oppt_data.get('TO', 0)
                oppt_ast = oppt_data['AST']
                oppt_stl = oppt_data['STL']
                oppt_blk = oppt_data['BLK']
                oppt_pf = oppt_data['PF']
                oppt_pts = oppt_data['PTS']

                # Advanced stats calculations
                team_poss = calculate_possessions(fga, to, fta)
                oppt_poss = calculate_possessions(oppt_fga, oppt_to, oppt_fta)

                treb_pct = (trb * 100) / (trb + oppt_trb) if (trb + oppt_trb) > 0 else 0
                asst_pct = (ast / fgm) * 100 if fgm > 0 else 0
                ts_pct = pts / (2 * (fga + (fta * 0.44))) * 100 if (fga + (fta * 0.44)) > 0 else 0
                efg_pct = (fgm + (three_pm / 2)) / fga * 100 if fga > 0 else 0
                oreb_pct = (orb * 100) / (orb + oppt_drb) if (orb + oppt_drb) > 0 else 0
                dreb_pct = (drb * 100) / (drb + oppt_orb) if (drb + oppt_orb) > 0 else 0
                to_pct = (to * 100) / (fga + 0.44 * fta + to) if (fga + 0.44 * fta + to) > 0 else 0
                stl_pct = (stl * 100) / team_poss if team_poss > 0 else 0
                blk_pct = (blk * 100) / team_poss if team_poss > 0 else 0
                blkr = (blk * 100) / oppt_two_pa if oppt_two_pa > 0 else 0
                pps = pts / fga if fga > 0 else 0
                fic = pts + orb + (0.75 * drb) + ast + stl + blk - (0.75 * fga) - (0.375 * fta) - to - (0.5 * pf)
                fic40 = (fic * 40 * 5) / min_played if min_played > 0 else 0
                ortg = (pts * 100) / team_poss if team_poss > 0 else 0
                drtg = (oppt_pts * 100) / team_poss if team_poss > 0 else 0
                ediff = ortg - drtg
                play_pct = fgm / (fga - orb + to) if (fga - orb + to) > 0 else 0
                ar = (ast * 100) / (fga - 0.44 * fta + ast + to) if (fga - 0.44 * fta + ast + to) > 0 else 0
                ast_to = ast / to if to > 0 else 0
                pace = (team_poss * 48 * 5) / min_played if min_played > 0 else 0
                stl_to = stl / to if to > 0 else 0

                # Opponent advanced stats
                oppt_treb_pct = (oppt_trb * 100) / (oppt_trb + trb) if (oppt_trb + trb) > 0 else 0
                oppt_asst_pct = (oppt_ast / oppt_fgm) * 100 if oppt_fgm > 0 else 0
                oppt_ts_pct = oppt_pts / (2 * (oppt_fga + (oppt_fta * 0.44))) * 100 if (oppt_fga + (oppt_fta * 0.44)) > 0 else 0
                oppt_efg_pct = (oppt_fgm + (oppt_three_pm / 2)) / oppt_fga * 100 if oppt_fga > 0 else 0
                oppt_oreb_pct = (oppt_orb * 100) / (oppt_orb + drb) if (oppt_orb + drb) > 0 else 0
                oppt_dreb_pct = (oppt_drb * 100) / (oppt_drb + orb) if (oppt_drb + orb) > 0 else 0
                oppt_to_pct = (oppt_to * 100) / (oppt_fga + 0.44 * oppt_fta + oppt_to) if (oppt_fga + 0.44 * oppt_fta + oppt_to) > 0 else 0
                oppt_stl_pct = (oppt_stl * 100) / oppt_poss if oppt_poss > 0 else 0
                oppt_blk_pct = (oppt_blk * 100) / oppt_poss if oppt_poss > 0 else 0
                oppt_blkr = (oppt_blk * 100) / two_pa if two_pa > 0 else 0
                oppt_pps = oppt_pts / oppt_fga if oppt_fga > 0 else 0
                oppt_fic = oppt_pts + oppt_orb + (0.75 * oppt_drb) + oppt_ast + oppt_stl + oppt_blk - (0.75 * oppt_fga) - (0.375 * oppt_fta) - oppt_to - (0.5 * oppt_pf)
                oppt_fic40 = (oppt_fic * 40 * 5) / min_played if min_played > 0 else 0
                oppt_ortg = (oppt_pts * 100) / oppt_poss if oppt_poss > 0 else 0
                oppt_drtg = (pts * 100) / oppt_poss if oppt_poss > 0 else 0
                oppt_ediff = oppt_ortg - oppt_drtg
                oppt_play_pct = oppt_fgm / (oppt_fga - oppt_orb + oppt_to) if (oppt_fga - oppt_orb + oppt_to) > 0 else 0
                oppt_ar = (oppt_ast * 100) / (oppt_fga - 0.44 * oppt_fta + oppt_ast + oppt_to) if (oppt_fga - 0.44 * oppt_fta + oppt_ast + oppt_to) > 0 else 0
                oppt_ast_to = oppt_ast / oppt_to if oppt_to > 0 else 0
                oppt_pace = (oppt_poss * 48 * 5) / min_played if min_played > 0 else 0
                oppt_stl_to = oppt_stl / oppt_to if oppt_to > 0 else 0

                game_record = {
                    'gmDate': game_date,
                    'seasonType': 'Regular',
                    'season': season_str,
                    'teamWins': 0,
                    'teamLosses': 0,
                    'teamAbbr': team_data['TEAM_ABBREVIATION'],
                    'teamLoc': loc,
                    'teamRslt': rslt,
                    'teamDayOff': 0,
                    'teamPTS': pts,
                    'teamAST': ast,
                    'teamTO': to,
                    'teamMin': min_played,
                    'teamSTL': stl,
                    'teamBLK': blk,
                    'teamPF': pf,
                    'teamFGA': fga,
                    'teamFGM': fgm,
                    'teamFG%': fg_pct,
                    'team2PA': two_pa,
                    'team2PM': two_pm,
                    'team2P%': two_p_pct,
                    'team3PA': three_pa,
                    'team3PM': three_pm,
                    'team3P%': three_p_pct,
                    'teamFTA': fta,
                    'teamFTM': ftm,
                    'teamFT%': ft_pct,
                    'teamORB': orb,
                    'teamDRB': drb,
                    'teamTRB': trb,
                    'teamTREB%': treb_pct,
                    'teamASST%': asst_pct,
                    'teamTS%': ts_pct,
                    'teamEFG%': efg_pct,
                    'teamOREB%': oreb_pct,
                    'teamDREB%': dreb_pct,
                    'teamTO%': to_pct,
                    'teamSTL%': stl_pct,
                    'teamBLK%': blk_pct,
                    'teamBLKR': blkr,
                    'teamPPS': pps,
                    'teamFIC': fic,
                    'teamFIC40': fic40,
                    'teamOrtg': ortg,
                    'teamDrtg': drtg,
                    'teamEDiff': ediff,
                    'teamPlay%': play_pct,
                    'teamAR': ar,
                    'teamPoss': team_poss,
                    'teamAST/TO': ast_to,
                    'teamPace': pace,
                    'teamSTL/TO': stl_to,
                    'opptWins': 0,
                    'opptLosses': 0,
                    'opptAbbr': oppt_data['TEAM_ABBREVIATION'],
                    'opptLoc': 'Away' if loc == 'Home' else 'Home',
                    'opptRslt': 'Loss' if rslt == 'Win' else 'Win',
                    'opptDayOff': 0,
                    'opptPTS': oppt_pts,
                    'opptAST': oppt_ast,
                    'opptTO': oppt_to,
                    'opptMin': min_played,
                    'opptSTL': oppt_stl,
                    'opptBLK': oppt_blk,
                    'opptPF': oppt_pf,
                    'opptFGA': oppt_fga,
                    'opptFGM': oppt_fgm,
                    'opptFG%': oppt_fg_pct,
                    'oppt2PA': oppt_two_pa,
                    'oppt2PM': oppt_two_pm,
                    'oppt2P%': oppt_two_p_pct,
                    'oppt3PA': oppt_three_pa,
                    'oppt3PM': oppt_three_pm,
                    'oppt3P%': oppt_three_p_pct,
                    'opptFTA': oppt_fta,
                    'opptFTM': oppt_ftm,
                    'opptFT%': ft_pct,
                    'opptORB': oppt_orb,
                    'opptDRB': oppt_drb,
                    'opptTRB': oppt_trb,
                    'opptTREB%': oppt_treb_pct,
                    'opptASST%': oppt_asst_pct,
                    'opptTS%': oppt_ts_pct,
                    'opptEFG%': oppt_efg_pct,
                    'opptOREB%': oppt_oreb_pct,
                    'opptDREB%': oppt_dreb_pct,
                    'opptTO%': oppt_to_pct,
                    'opptSTL%': oppt_stl_pct,
                    'opptBLK%': oppt_blk_pct,
                    'opptBLKR': oppt_blkr,
                    'opptPPS': oppt_pps,
                    'opptFIC': oppt_fic,
                    'opptFIC40': oppt_fic40,
                    'opptOrtg': oppt_ortg,
                    'opptDrtg': oppt_drtg,
                    'opptEDiff': oppt_ediff,
                    'opptPlay%': oppt_play_pct,
                    'opptAR': oppt_ar,
                    'opptPoss': oppt_poss,
                    'opptAST/TO': oppt_ast_to,
                    'opptPace': oppt_pace,
                    'opptSTL/TO': oppt_stl_to,
                    'matchWinner': winner
                }
                new_games.append(game_record)

        print(f"Processed {len(games)} games for season {season_str}.")
        time.sleep(1)  # Respect API rate limits

    except Exception as e:
        print(f"Error fetching data for season {season_str}: {e}")
        continue

# Create a DataFrame for new data
if new_games:
    df_new = pd.DataFrame(new_games)
    # Ensure columns match the existing dataset
    df_new = df_new[df_existing.columns]
    # Combine datasets
    df_combined = pd.concat([df_existing, df_new], ignore_index=True)
    # Save the updated dataset
    df_combined.to_csv(UPDATED_CSV, index=False)
    print(f"Updated dataset saved as {UPDATED_CSV} with {len(df_combined)} rows.")
else:
    print("No new data was collected.")
Appendix 2: Plotting the Stats
import pandas as pd
import matplotlib.pyplot as plt

# --- Configuration ---
CSV_FILE = "1997-2024_officialBoxScore.csv"
TOTAL_OUTPUT_FILE = "wnba_total_stats_plots.png"
AVG_OUTPUT_FILE = "wnba_avg_per_game_plots.png"

# Load the dataset
print(f"Loading dataset: {CSV_FILE}")
df = pd.read_csv(CSV_FILE)

# Calculate total rebounds (ORB + DRB)
df['teamREB'] = df['teamORB'] + df['teamDRB']

# Aggregate data by season for totals
season_stats = df.groupby('season').agg({
    'teamPTS': 'sum',
    'teamREB': 'sum',
    'teamAST': 'sum',
    'team3PM': 'sum'
}).reset_index()

# Adjust for double-counting (each game has two teams)
season_stats[['teamPTS', 'teamREB', 'teamAST', 'team3PM']] = season_stats[['teamPTS', 'teamREB', 'teamAST', 'team3PM']] / 2

# Count the number of games per season (each game has two rows, so divide by 2)
game_counts = df.groupby('season').size() / 2
season_stats = season_stats.merge(pd.DataFrame({'season': game_counts.index, 'games': game_counts.values}), on='season')

# Calculate averages per game
season_stats['avgPTS'] = season_stats['teamPTS'] / season_stats['games']
season_stats['avgREB'] = season_stats['teamREB'] / season_stats['games']
season_stats['avgAST'] = season_stats['teamAST'] / season_stats['games']
season_stats['avg3PM'] = season_stats['team3PM'] / season_stats['games']

# Convert season to numeric year for plotting (use the first year of the season)
season_stats['Year'] = season_stats['season'].str[:4].astype(int)

# --- Plot 1: Total Stats Over Time ---
fig1, axes1 = plt.subplots(2, 2, figsize=(14, 10))
axes1 = axes1.flatten()

# Total Points
axes1[0].plot(season_stats['Year'], season_stats['teamPTS'], label='Total Points', marker='o', markersize=4, linewidth=2, color='blue')
axes1[0].set_title('Total Points Over Time', fontsize=12)
axes1[0].set_xlabel('Year', fontsize=10)
axes1[0].set_ylabel('Total Points', fontsize=10)
axes1[0].grid(True, linestyle='--', alpha=0.6)
axes1[0].set_xticks(season_stats['Year'][::4])
axes1[0].tick_params(axis='x', rotation=45)

# Total Rebounds
axes1[1].plot(season_stats['Year'], season_stats['teamREB'], label='Total Rebounds', marker='o', markersize=4, linewidth=2, color='green')
axes1[1].set_title('Total Rebounds Over Time', fontsize=12)
axes1[1].set_xlabel('Year', fontsize=10)
axes1[1].set_ylabel('Total Rebounds', fontsize=10)
axes1[1].grid(True, linestyle='--', alpha=0.6)
axes1[1].set_xticks(season_stats['Year'][::4])
axes1[1].tick_params(axis='x', rotation=45)

# Total Assists
axes1[2].plot(season_stats['Year'], season_stats['teamAST'], label='Total Assists', marker='o', markersize=4, linewidth=2, color='orange')
axes1[2].set_title('Total Assists Over Time', fontsize=12)
axes1[2].set_xlabel('Year', fontsize=10)
axes1[2].set_ylabel('Total Assists', fontsize=10)
axes1[2].grid(True, linestyle='--', alpha=0.6)  # Fixed typo: gridÝ -> grid
axes1[2].set_xticks(season_stats['Year'][::4])
axes1[2].tick_params(axis='x', rotation=45)

# Total Three Pointers Made
axes1[3].plot(season_stats['Year'], season_stats['team3PM'], label='Total Three Pointers Made', marker='o', markersize=4, linewidth=2, color='purple')
axes1[3].set_title('Total Three Pointers Made Over Time', fontsize=12)
axes1[3].set_xlabel('Year', fontsize=10)
axes1[3].set_ylabel('Total Three Pointers', fontsize=10)
axes1[3].grid(True, linestyle='--', alpha=0.6)
axes1[3].set_xticks(season_stats['Year'][::4])
axes1[3].tick_params(axis='x', rotation=45)

# Adjust layout and save the first plot
plt.suptitle('WNBA Stats Over Time (1997 - 2024)', fontsize=16)
plt.tight_layout(rect=[0, 0, 1, 0.95])
plt.savefig(TOTAL_OUTPUT_FILE, dpi=300, bbox_inches='tight')
print(f"Total stats plot saved as {TOTAL_OUTPUT_FILE}")

# --- Plot 2: Average Stats per Game ---
fig2, axes2 = plt.subplots(2, 2, figsize=(14, 10))
axes2 = axes2.flatten()

# Average Points per Game
axes2[0].plot(season_stats['Year'], season_stats['avgPTS'], label='Average Points per Game', marker='o', markersize=4, linewidth=2, color='blue')
axes2[0].set_title('Average Points per Game Over Time', fontsize=12)
axes2[0].set_xlabel('Year', fontsize=10)
axes2[0].set_ylabel('Average Points per Game', fontsize=10)
axes2[0].grid(True, linestyle='--', alpha=0.6)
axes2[0].set_xticks(season_stats['Year'][::4])
axes2[0].tick_params(axis='x', rotation=45)

# Average Rebounds per Game
axes2[1].plot(season_stats['Year'], season_stats['avgREB'], label='Average Rebounds per Game', marker='o', markersize=4, linewidth=2, color='green')
axes2[1].set_title('Average Rebounds per Game Over Time', fontsize=12)
axes2[1].set_xlabel('Year', fontsize=10)
axes2[1].set_ylabel('Average Rebounds per Game', fontsize=10)
axes2[1].grid(True, linestyle='--', alpha=0.6)
axes2[1].set_xticks(season_stats['Year'][::4])
axes2[1].tick_params(axis='x', rotation=45)

# Average Assists per Game
axes2[2].plot(season_stats['Year'], season_stats['avgAST'], label='Average Assists per Game', marker='o', markersize=4, linewidth=2, color='orange')
axes2[2].set_title('Average Assists per Game Over Time', fontsize=12)
axes2[2].set_xlabel('Year', fontsize=10)
axes2[2].set_ylabel('Average Assists per Game', fontsize=10)
axes2[2].grid(True, linestyle='--', alpha=0.6)
axes2[2].set_xticks(season_stats['Year'][::4])
axes2[2].tick_params(axis='x', rotation=45)

# Average Three Pointers Made per Game
axes2[3].plot(season_stats['Year'], season_stats['avg3PM'], label='Average Three Pointers per Game', marker='o', markersize=4, linewidth=2, color='purple')
axes2[3].set_title('Average Three Pointers per Game Over Time', fontsize=12)
axes2[3].set_xlabel('Year', fontsize=10)
axes2[3].set_ylabel('Average Three Pointers per Game', fontsize=10)
axes2[3].grid(True, linestyle='--', alpha=0.6)
axes2[3].set_xticks(season_stats['Year'][::4])
axes2[3].tick_params(axis='x', rotation=45)

# Adjust layout and save the second plot
plt.suptitle('WNBA Average Stats per Game (1997 - 2024)', fontsize=16)
plt.tight_layout(rect=[0, 0, 1, 0.95])
plt.savefig(AVG_OUTPUT_FILE, dpi=300, bbox_inches='tight')
print(f"Average per game plot saved as {AVG_OUTPUT_FILE}")

# Display both plots
plt.show()
python data parsing data extraction data analysis WNBA basketball WNBA Regular Season nba_api nba_api.stats.endpoints python for sports pandas seaborn data visualization scipy matplotlib numpy BeautifulSoup json
2369 Words
2025-06-04 12:00