8 minutes
NBA Playoff Blowouts
Watching the 2025 NBA Playoffs has been a bit strange: huge blowouts (sometimes, often, unexpected) follow by razor-tight contests that go down to the very last possession or even into overtime.
After the Denver Nuggets’ exit from the playoffs at the hands of the OKC Thunder, Aaron Gordon of the Nuggets has a rather intriguing post-game press conference where he himself mentioned the “blowouts” thing (thus making it not something just in my head, I suppose).
I thought this posed an interesting little bit of research one could do (NBA stat/history purists will probably know a lot of this, but I did not): when did the NBA change the scheduling to alter the number of rest days, has the one rest day between games been the norm now for a while or not, etc.? Furthermore, after the changes, have we seen more blowout wins or less?
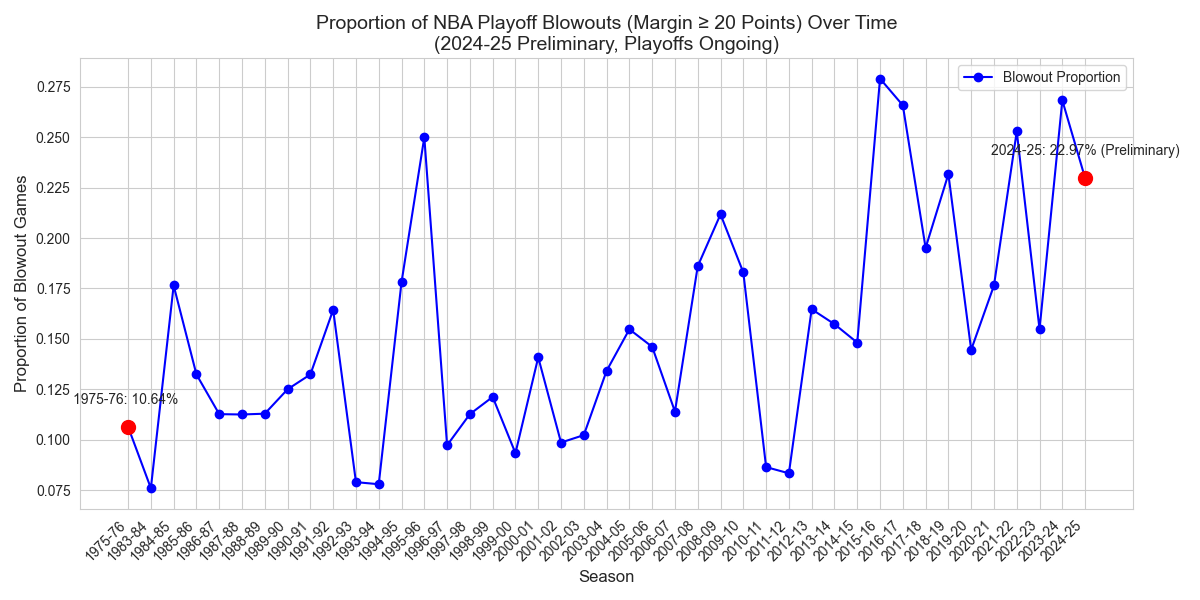
So let’s just see what we can see—not incorporating any historical detail/data just yet—and we’ll pull some data just to see how many blowouts (winning margin more than twenty points) there have been in the playoffs since the 1975-76 season:
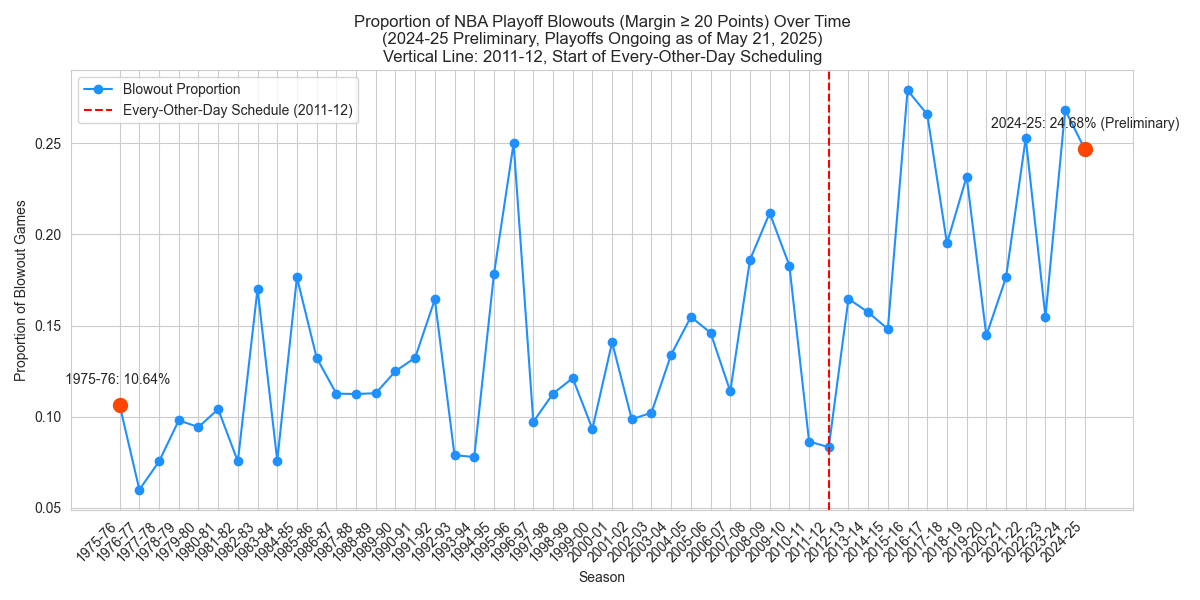
Now, after a little bit of googling, it seems like 2013 is the year when the format was changed—the schedule for the Finals allowed for two days of rest in between games, but all the other rounds went to one.
So, let’s write some code to determine if there have been more blowout wins since 2013 as compared to previous years and see what we can see—or, in other words, is Aaron Gordon right to say that the smaller number of rest days might be connected to the blowout phenomenon. (Also, one should say that Gordon himself was dealing with an injury in games 6 and 7, so we should factor that into his opinion/position as well).
I pulled all the data I could from the 1975-76 season all the way up until yesterday’s most recent playoff game. And from that we can create a plot of blowout victories (again, blowouts being defined by a winning margin of more than 20 points—if one would like to alter this to 15 or 10 that’s easy enough and they can do so in the code that will follow down at the end below):
Is there another way to visualize whether there’s been a trending increase over time? For sure:
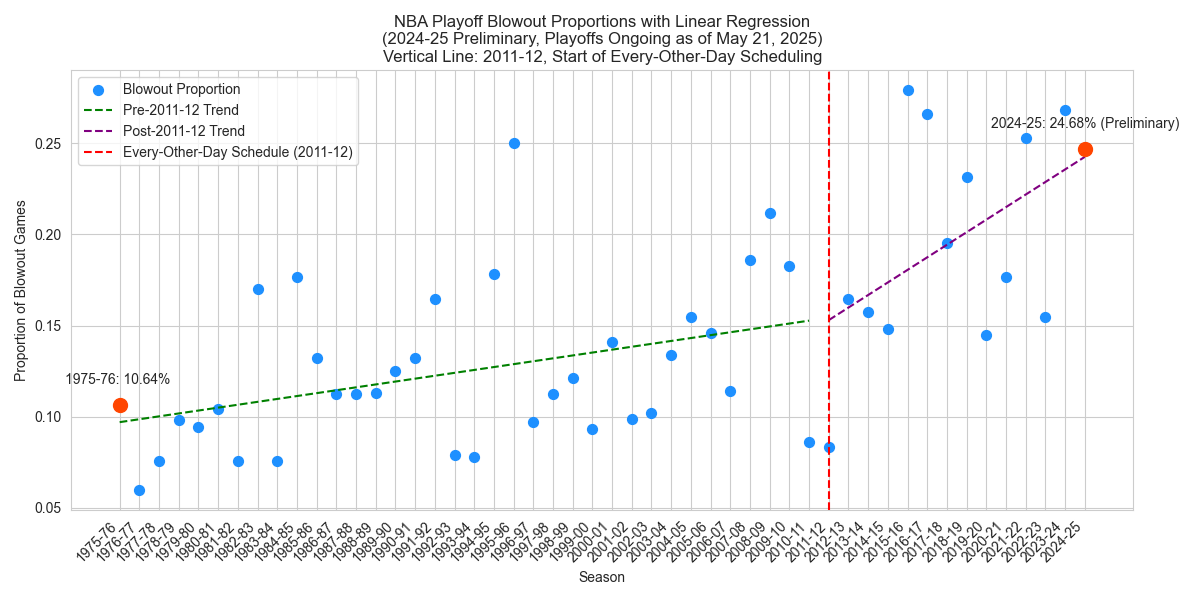
Looking at these, Gordon might be on to something—we certainly do not want to say rest days is the only factor in a possible explanation for the increased blowouts, but it is certainly something to keep in mind.
For those interested in the code to produce both plots—and also so you can tweak the winning margin to see if that changes things—I’ll stick it in the Appendix below. Feel free to experiment and mess around a little bit (grab historical data going back past the ‘1975-76 season, collect regular season data and compare it with the playoffs, etc.) with this starter code.
P.S. As the NBA Finals continue I’ll update the graphs accordingly, of course.
Appendix
import pandas as pd
import seaborn as sns
import matplotlib.pyplot as plt
import numpy as np
from nba_api.stats.endpoints import leaguegamefinder
import time
import os
import requests
from bs4 import BeautifulSoup
from io import StringIO
import json
from scipy.stats import linregress

# Set seaborn style for better visuals
sns.set_style("whitegrid")

# Function to fetch playoff game data for a given season via nba_api
def get_playoff_games(season):
    try:
        gamefinder = leaguegamefinder.LeagueGameFinder(
            season_nullable=season,
            season_type_nullable='Playoffs',
            league_id_nullable='00'
        )
        games = gamefinder.get_data_frames()[0]
        games['GAME_DATE'] = pd.to_datetime(games['GAME_DATE'], errors='coerce')
        games['SEASON'] = season
        time.sleep(0.6)  # Avoid API rate limits
        print(f"Season {season}: {len(games)} games, Date Range: {games['GAME_DATE'].min()} to {games['GAME_DATE'].max()}")
        return games
    except Exception as e:
        print(f"Error fetching data for season {season}: {e}")
        return pd.DataFrame()

# Function to scrape playoff games from Basketball-Reference for a given year
def scrape_bbref_playoffs(year, season):
    url = f"https://www.basketball-reference.com/playoffs/NBA_{year}_games.html"
    try:
        response = requests.get(url)
        if response.status_code != 200:
            print(f"Failed to fetch data for {year}")
            return pd.DataFrame()

        soup = BeautifulSoup(response.text, 'html.parser')
        table = soup.find('table', class_='stats_table')
        if not table:
            print(f"No playoff games table found for {year}")
            return pd.DataFrame()

        df = pd.read_html(StringIO(str(table)))[0]
        df = df.rename(columns={
            'Date': 'GAME_DATE',
            'Visitor/Neutral': 'Away_Team',
            'Home/Neutral': 'Home_Team',
            'PTS': 'Away_PTS',
            'PTS.1': 'Home_PTS'
        })
        df['SEASON'] = season
        df['GAME_DATE'] = pd.to_datetime(df['GAME_DATE'], errors='coerce')
        df['TEAM_ABBREVIATION'] = df['Home_Team']
        df['MATCHUP'] = df.apply(lambda row: f"{row['Home_Team']} vs. {row['Away_Team']}", axis=1)
        df['PTS'] = df['Home_PTS']
        away_df = df.copy()
        away_df['TEAM_ABBREVIATION'] = df['Away_Team']
        away_df['MATCHUP'] = df.apply(lambda row: f"{row['Away_Team']} @ {row['Home_Team']}", axis=1)
        away_df['PTS'] = df['Away_PTS']
        return pd.concat([df, away_df], ignore_index=True)[['SEASON', 'GAME_DATE', 'TEAM_ABBREVIATION', 'MATCHUP', 'PTS']]
    except Exception as e:
        print(f"Error scraping data for {year}: {e}")
        return pd.DataFrame()

# Load or scrape data for 1975-76 to 1982-83
missing_seasons = [(year, f"{year}-{str(year+1)[2:]}") for year in range(1975, 1983)]
all_games = pd.DataFrame()
for year, season in missing_seasons:
    csv_file = f"nba_playoff_{year}.csv"
    if os.path.exists(csv_file):
        df = pd.read_csv(csv_file)
        print(f"Loaded {season} data from {csv_file}: {len(df)} rows")
    else:
        df = scrape_bbref_playoffs(year, season)
        if not df.empty:
            df.to_csv(csv_file, index=False)
            print(f"Scraped and saved {season} data to {csv_file}: {len(df)} rows")
        else:
            print(f"Failed to scrape {season} data")
    if not df.empty:
        all_games = pd.concat([all_games, df], ignore_index=True, sort=False)

# Generate list of seasons from 1975-76 to 2024-25 for API fetching
seasons = [f"{year}-{str(year+1)[2:]}" for year in range(1975, 2025)]

# Fetch data for all seasons via API
for season in seasons:
    print(f"Fetching data for {season}...")
    season_games = get_playoff_games(season)
    if not season_games.empty:
        all_games = pd.concat([all_games, season_games], ignore_index=True, sort=False)
    else:
        print(f"Season {season}: No data available")

# Deduplicate 2024-25 data
if '2024-25' in all_games['SEASON'].values:
    all_games_2025 = all_games[all_games['SEASON'] == '2024-25']
    pre_dedup_count = len(all_games_2025)
    all_games_2025 = all_games_2025.drop_duplicates(subset=['GAME_DATE', 'MATCHUP'])
    post_dedup_count = len(all_games_2025)
    print(f"Deduplicated 2024-25 data: {pre_dedup_count} rows reduced to {post_dedup_count} rows")
    all_games = pd.concat([all_games[all_games['SEASON'] != '2024-25'], all_games_2025], ignore_index=True, sort=False)

# Check if data was retrieved
if all_games.empty:
    print("No data retrieved. Check API access or data availability.")
    exit()

# Process data to calculate margin of victory
def calculate_margin(row):
    if 'vs.' in row['MATCHUP']:
        home_team = row['TEAM_ABBREVIATION']
        home_score = row['PTS']
        away_team = row['MATCHUP'].split('vs.')[1].strip()
        away_row = all_games[(all_games['MATCHUP'].str.contains(f"{away_team} @ {home_team}")) &
                             (all_games['GAME_DATE'] == row['GAME_DATE'])]
        if not away_row.empty:
            away_score = away_row['PTS'].iloc[0]
            return abs(home_score - away_score)
    return None

# Apply margin calculation (only for home team rows)
home_games = all_games[all_games['MATCHUP'].str.contains('vs.')]
all_games['Margin'] = home_games.apply(calculate_margin, axis=1)

# Identify blowouts (margin >= 20 points)
all_games['Blowout'] = all_games['Margin'] >= 20

# Group by season to calculate blowout proportion
blowout_stats = all_games[all_games['MATCHUP'].str.contains('vs.')].groupby('SEASON').agg({
    'Blowout': ['sum', 'count']
}).reset_index()

# Flatten column names
blowout_stats.columns = ['Season', 'Blowout_Count', 'Total_Games']

# Calculate blowout proportion
blowout_stats['Blowout_Proportion'] = blowout_stats['Blowout_Count'] / blowout_stats['Total_Games']

# Create Chart.js configuration with a vertical line for 2011-12
chart_data = {
    "type": "line",
    "data": {
        "labels": blowout_stats['Season'].tolist(),
        "datasets": [{
            "label": "Blowout Proportion",
            "data": blowout_stats['Blowout_Proportion'].tolist(),
            "fill": False,
            "borderColor": "#1e90ff",
            "backgroundColor": "#1e90ff",
            "pointRadius": 5,
            "pointHoverRadius": 8
        }]
    },
    "options": {
        "plugins": {
            "title": {
                "display": True,
                "text": "Proportion of NBA Playoff Blowouts (Margin ≥ 20 Points) Over Time\n(2024-25 Preliminary, Playoffs Ongoing as of May 21, 2025)\nVertical Line: 2011-12, Start of Every-Other-Day Scheduling",
                "font": {"size": 14}
            },
            "legend": {"display": True},
            "annotation": {
                "annotations": [{
                    "type": "line",
                    "xMin": "2011-12",
                    "xMax": "2011-12",
                    "borderColor": "#ff0000",
                    "borderWidth": 2,
                    "label": {
                        "enabled": True,
                        "content": "Every-Other-Day Schedule (2011-12)",
                        "position": "top",
                        "backgroundColor": "rgba(255, 0, 0, 0.8)",
                        "font": {"size": 12}
                    }
                }]
            }
        },
        "scales": {
            "x": {
                "title": {"display": True, "text": "Season"},
                "ticks": {"maxRotation": 45, "minRotation": 45}
            },
            "y": {
                "title": {"display": True, "text": "Proportion of Blowout Games"},
                "beginAtZero": True
            }
        }
    }
}

# Highlight 1975-76 and 2024-25 in the chart
highlight_seasons = ['1975-76', '2024-25']
for season in highlight_seasons:
    if season in blowout_stats['Season'].values:
        proportion = blowout_stats.loc[blowout_stats['Season'] == season, 'Blowout_Proportion'].values[0]
        chart_data["data"]["datasets"].append({
            "label": f"{season} {'(Preliminary)' if season == '2024-25' else ''}",
            "data": [proportion if s == season else None for s in blowout_stats['Season']],
            "type": "scatter",
            "backgroundColor": "#ff4500",
            "pointRadius": 8,
            "pointHoverRadius": 10,
            "showLine": False
        })

# Save the Chart.js configuration
chart_file = 'nba_blowout_trend_with_rest_line.json'
with open(chart_file, 'w') as f:
    json.dump(chart_data, f, indent=2)
print(f"Saved Chart.js configuration to {chart_file}")

# Create matplotlib line plot (existing)
plt.figure(figsize=(12, 6))
plt.plot(blowout_stats['Season'], blowout_stats['Blowout_Proportion'], marker='o', color='#1e90ff', label='Blowout Proportion')
plt.axvline(x='2011-12', color='red', linestyle='--', label='Every-Other-Day Schedule (2011-12)')
for season in highlight_seasons:
    if season in blowout_stats['Season'].values:
        proportion = blowout_stats.loc[blowout_stats['Season'] == season, 'Blowout_Proportion'].values[0]
        plt.scatter(season, proportion, color='#ff4500', s=100, zorder=5)
        plt.text(season, proportion + 0.01, f"{season}: {proportion:.2%} {'(Preliminary)' if season == '2024-25' else ''}",
                 ha='center', va='bottom')
plt.title('Proportion of NBA Playoff Blowouts (Margin ≥ 20 Points) Over Time\n(2024-25 Preliminary, Playoffs Ongoing as of May 21, 2025)\nVertical Line: 2011-12, Start of Every-Other-Day Scheduling', fontsize=12)
plt.xlabel('Season')
plt.ylabel('Proportion of Blowout Games')
plt.xticks(rotation=45, ha='right')
plt.legend()
plt.grid(True)
plt.tight_layout()
png_file = 'nba_blowout_trend_with_rest_line.png'
plt.savefig(png_file)
plt.close()
print(f"Saved matplotlib line plot to {png_file}")

# Create scatterplot with linear regression lines
plt.figure(figsize=(12, 6))
# Scatterplot
plt.scatter(blowout_stats['Season'], blowout_stats['Blowout_Proportion'], color='#1e90ff', label='Blowout Proportion', s=50)
# Split data at 2011-12
pre_2011 = blowout_stats[blowout_stats['Season'] <= '2010-11']
post_2011 = blowout_stats[blowout_stats['Season'] >= '2011-12']
# Numeric index for regression
pre_2011['Year_Index'] = range(len(pre_2011))
post_2011['Year_Index'] = range(len(pre_2011), len(pre_2011) + len(post_2011))
# Linear regression for pre-2011-12
if len(pre_2011) > 1:
    slope_pre, intercept_pre, _, _, _ = linregress(pre_2011['Year_Index'], pre_2011['Blowout_Proportion'])
    pre_line = intercept_pre + slope_pre * pre_2011['Year_Index']
    plt.plot(pre_2011['Season'], pre_line, color='green', linestyle='--', label='Pre-2011-12 Trend')
# Linear regression for post-2011-12
if len(post_2011) > 1:
    slope_post, intercept_post, _, _, _ = linregress(post_2011['Year_Index'], post_2011['Blowout_Proportion'])
    post_line = intercept_post + slope_post * post_2011['Year_Index']
    plt.plot(post_2011['Season'], post_line, color='purple', linestyle='--', label='Post-2011-12 Trend')
# Vertical line at 2011-12
plt.axvline(x='2011-12', color='red', linestyle='--', label='Every-Other-Day Schedule (2011-12)')
# Highlight 1975-76 and 2024-25
for season in highlight_seasons:
    if season in blowout_stats['Season'].values:
        proportion = blowout_stats.loc[blowout_stats['Season'] == season, 'Blowout_Proportion'].values[0]
        plt.scatter(season, proportion, color='#ff4500', s=100, zorder=5)
        plt.text(season, proportion + 0.01, f"{season}: {proportion:.2%} {'(Preliminary)' if season == '2024-25' else ''}",
                 ha='center', va='bottom')
plt.title('NBA Playoff Blowout Proportions with Linear Regression\n(2024-25 Preliminary, Playoffs Ongoing as of May 21, 2025)\nVertical Line: 2011-12, Start of Every-Other-Day Scheduling', fontsize=12)
plt.xlabel('Season')
plt.ylabel('Proportion of Blowout Games')
plt.xticks(rotation=45, ha='right')
plt.legend()
plt.grid(True)
plt.tight_layout()
regression_file = 'nba_blowout_regression_trend.png'
plt.savefig(regression_file)
plt.close()
print(f"Saved matplotlib regression scatterplot to {regression_file}")

# Compare 1975-76 and 2024-25
if '1975-76' in blowout_stats['Season'].values and '2024-25' in blowout_stats['Season'].values:
    prop_1975 = blowout_stats.loc[blowout_stats['Season'] == '1975-76', 'Blowout_Proportion'].values[0]
    prop_2025 = blowout_stats.loc[blowout_stats['Season'] == '2024-25', 'Blowout_Proportion'].values[0]
    total_games_2025 = blowout_stats.loc[blowout_stats['Season'] == '2024-25', 'Total_Games'].values[0]
    print(f"1975-76 Blowout Proportion: {prop_1975:.2%} ({blowout_stats.loc[blowout_stats['Season'] == '1975-76', 'Total_Games'].values[0]} games)")
    print(f"2024-25 Blowout Proportion (Preliminary, {total_games_2025} games): {prop_2025:.2%}")
    if prop_2025 > prop_1975:
        print("The 2024-25 playoffs (preliminary) have a higher proportion of blowouts compared to 1975-76.")
    else:
        print("The 1975-76 playoffs had a higher or equal proportion of blowouts compared to 2024-25 (preliminary).")
else:
    print("Data for 1975-76 or 2024-25 is missing.")

# Save data to CSV
all_games.to_csv('nba_playoff_games.csv', index=False)
blowout_stats.to_csv('nba_blowout_stats.csv', index=False)
python data parsing data extraction data analysis nba_api NBA basketball NBA Playoffs python for sports pandas seaborn data visualization scipy matplotlib numpy BeautifulSoup json
1664 Words
2025-05-24 13:01