8 minutes
What Kind of Songs Do I Like? Goofing Around with the Spotify API and My Bizarre Music Tastes
Some Introductory Remarks
I was having a conversation with my most favorite student that I’ve ever had in my entire career as a teacher a while back and we got to chatting about my little pattern of sending her songs I like from the “Discover Weekly” and “Release Radar” playlists that come my way via Spotify. She and I seem to have very few similarities when it comes to music. She likes to say that I have somewhat “girlish” music tastes (not meant as a pejorative, far from it, at least, I think! that said, I seem to love everything NERIAH releases), but I like to think that I like certain songs based on how easy it is for me to move my body in tune with them. I figure I would do a little testing to see if my intuitions were correct or not. So, in order to do just that, off we go.
Data Collection
The first step was to hop over to the Spotify site for developers. You can follow some of the really nice tutorials on accessing the API (see here) … thus, with an application sent up, we should be good to go with accessing the API via Python. On that note, we will want to install the “spotipy” library (available (here)[https://spotipy.readthedocs.io/en/2.22.1/]). With that installed, we can start writing some code ourselves. We need a way to traverse the entirety of the “Liked Songs” playlist. As per usual, let’s write some code, which is simple enough (spotipy makes it really easy and simple, I should say). So let’s say we just want to create a .json file with all of our “Liked Songs”? Easy enough:
import json
import spotipy
from spotipy.oauth2 import SpotifyClientCredentials
from spotipy.oauth2 import SpotifyOAuth
import os
from datetime import datetime
from icecream import ic

os.environ['SPOTIPY_CLIENT_ID'] = # your own unique API credentials here
os.environ['SPOTIPY_CLIENT_SECRET'] = # your own unique API credentials here
os.environ['SPOTIPY_REDIRECT_URI'] = # your own unique API credentials here

scope = "user-library-read user-top-read"
spotify = spotipy.Spotify(client_credentials_manager=SpotifyClientCredentials())
sp = spotipy.Spotify(auth_manager=SpotifyOAuth(scope=scope))
print(sp.me())

results = []
offset = 0
limit = 50
while True:
    tracks = sp.current_user_saved_tracks(limit=limit, offset=offset)
    results += tracks['items']
    offset += len(tracks['items'])
    if len(tracks['items']) == 0:
        break

today = datetime.today().strftime('%Y-%m-%d')
with open(f'saved_tracks_test_{today}.json', 'w') as outfile:
    json.dump(results, outfile)

ic(f"Saved {len(results)} tracks to saved_tracks_test_{today}.json")
So, this will give us a .json file that has all of our “Liked Songs” in it.
Now that we have that code written, we can dig a little deeper into how we want/are going to use the spotipy library. Spotify has all kinds of definitions, ideas, data, explanations for their key numbers that describe a song’s “audio features.” Spotify’s numbers and definitions are available here. I am interested in figuring out how well my own musical sensitivity either converges or strongly diverges with those of other Spotify listeners. Here is some code to grab every single song from your “Liked Songs” playlist while also pulling down each song’s “audio features”:
with open('saved_tracks.json', 'r') as infile:
    saved_tracks = json.load(infile)
tracks_with_features = []
batch_size = 50
for i in range(0, len(saved_tracks), batch_size):
batch = saved_tracks[i:i+batch_size]
track_uris = [item["track"]["uri"] for item in batch]
track_infos = sp.tracks(track_uris)["tracks"]
audio_features = sp.audio_features(track_uris)
for j in range(len(batch)):
track = batch[j]["track"]
track_uri = track["uri"]
track_info = track_infos[j]
audio_feature = audio_features[j]
track_with_features = {
"name": track_info["name"],
"artist": track_info["artists"][0]["name"],
"album": track_info["album"]["name"],
"uri": track_uri,
"added_at": batch[j]["added_at"],
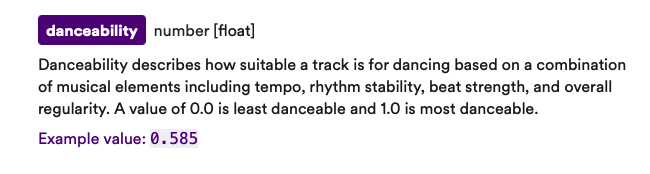
"danceability": audio_feature["danceability"],
"energy": audio_feature["energy"],
"key": audio_feature["key"],
"loudness": audio_feature["loudness"],
"mode": audio_feature["mode"],
"speechiness": audio_feature["speechiness"],
"acousticness": audio_feature["acousticness"],
"instrumentalness": audio_feature["instrumentalness"],
"liveness": audio_feature["liveness"],
"valence": audio_feature["valence"],
"tempo": audio_feature["tempo"],
"duration_ms": audio_feature["duration_ms"],
"time_signature": audio_feature["time_signature"]
}
tracks_with_features.append(track_with_features)
with open('saved_tracks_with_features.json', 'w') as outfile:
json.dump(tracks_with_features, outfile, indent=4)
print(f"Saved {len(tracks_with_features)} tracks with features to saved_tracks_with_features.json")
Thus we now have a .json file that stores all our “Liked Songs” and another separate file that has all of the songs’ “features.” So, what are the odds that when I use the phrase—as I did above—that I like songs that are easy to “move my body” to, that something is captured by an “audio feature” like “danceability”?
Of course, there’s no doubt this “definition” possesses quite a bit of ambiguity, to say the very least. One doesn’t need to be a big reader of Nietzsche to know that “to dance” is a shockingly vague pair of words to use: what kind of dance, how fast, how slow, etc. What on earth does it mean “to dance”? Well, I was kind of hoping that a bit of data analysis here might give me the opportunity to think about dance and dancing (and not simply because I have been working a lot as of late on dance and dancing as a figure of/for thinking in Nietzsche [this too is part of another project that “my most favorite student forever” I mentioned earlier and I are working on with regards to an early F. Scott Fitzgerald story]). So, does my “Liked Songs” list have a lot of songs that show a high degree of “danceability,” at least as far as Spotify is concerned? Well, let’s make some graphs and see:
Let’s Do Some Analysis!
So—I’ll link here to the Jupyter notebook with all the code used to generate these visualizations (and the entire repo is available here)—if we look at a histogram of the “danceability” numbers in my “Liked Songs” playlist, we get something that looks like this:
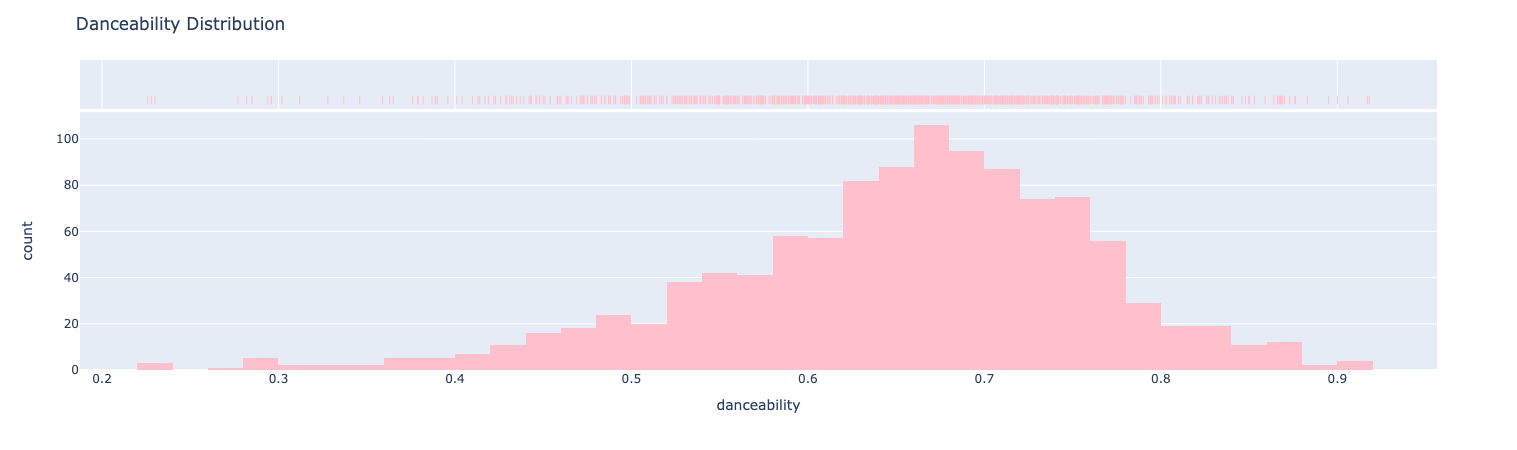
Hmmmmmm … okay, so I think this strikes me as a tad bit surprising (intriguing at the very least). I like to think that I literally only add songs to my “Liked Songs” if they’re easy to “move my body to” (although, to be sure, I have no doubt that’s an exaggeration). If we have a look at my mean danceability scores we can plot that as well:
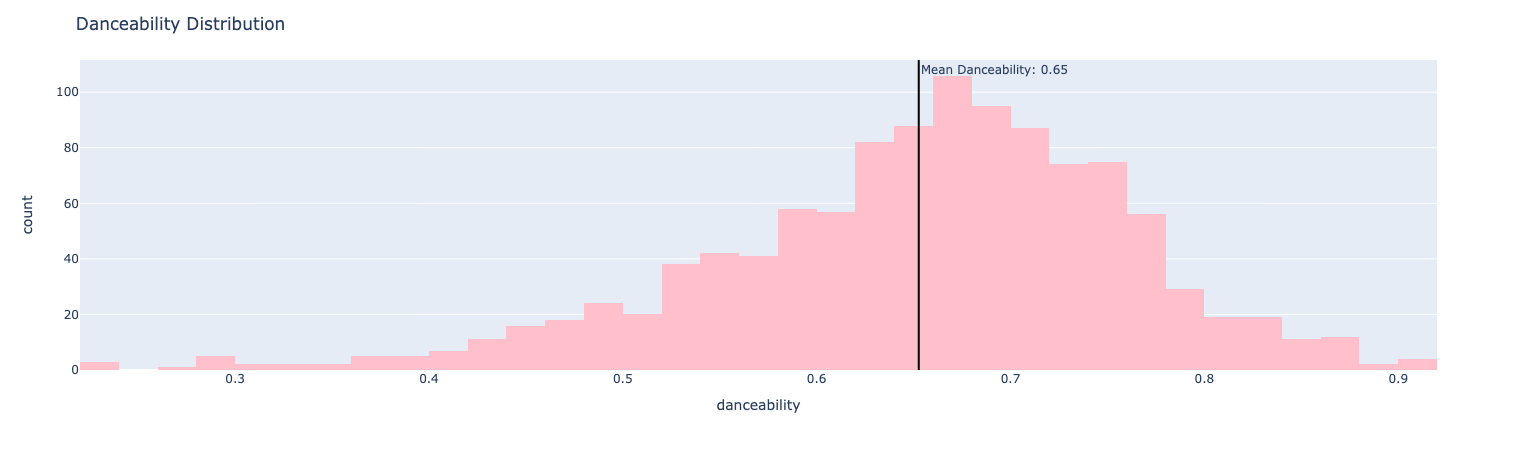
I would love to know how this histogram compares to other Spotify listeners. What’s the mean danceability score for the “Liked Songs” in users’ playlists? Is my distribution slightly above the mean, slightly below, …? Is my sense of “danceability” at all in line with other users’ conceptions of such a thing?
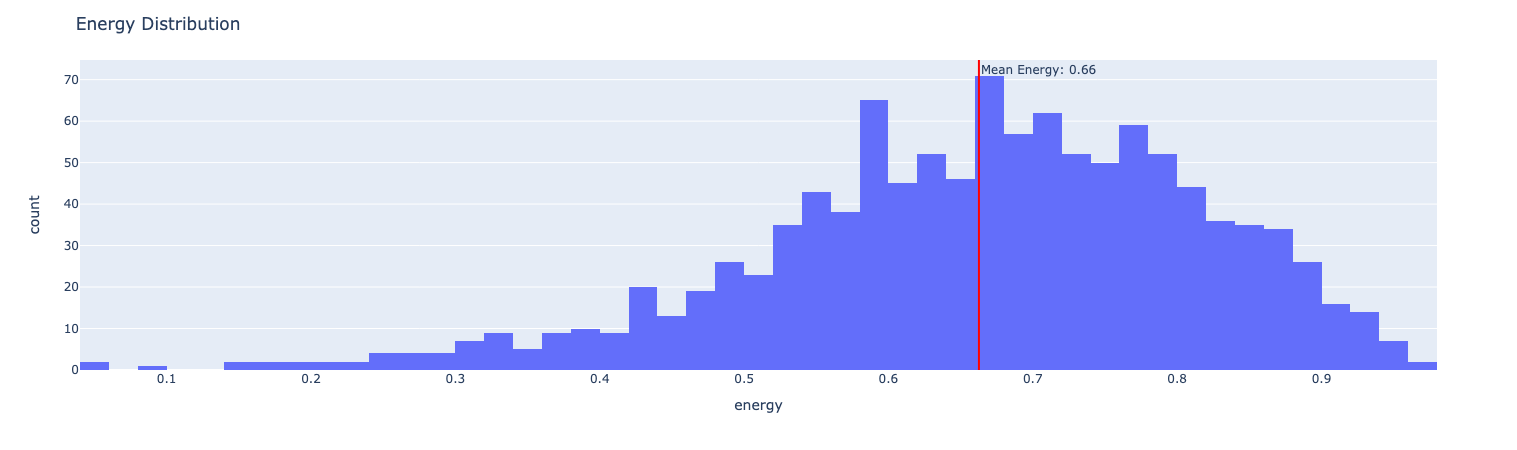
What about the “energy” feature, too? Might that be a better bet …?
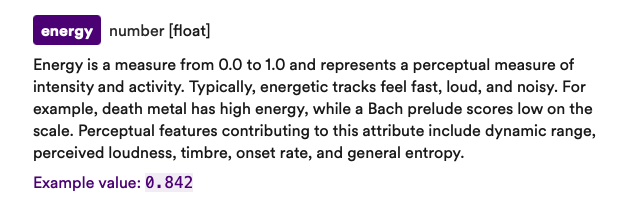
Probably not, given the examples here: I don’t dig “death metal” at all.
We can also easily plot these two features together and see what there is to see there:
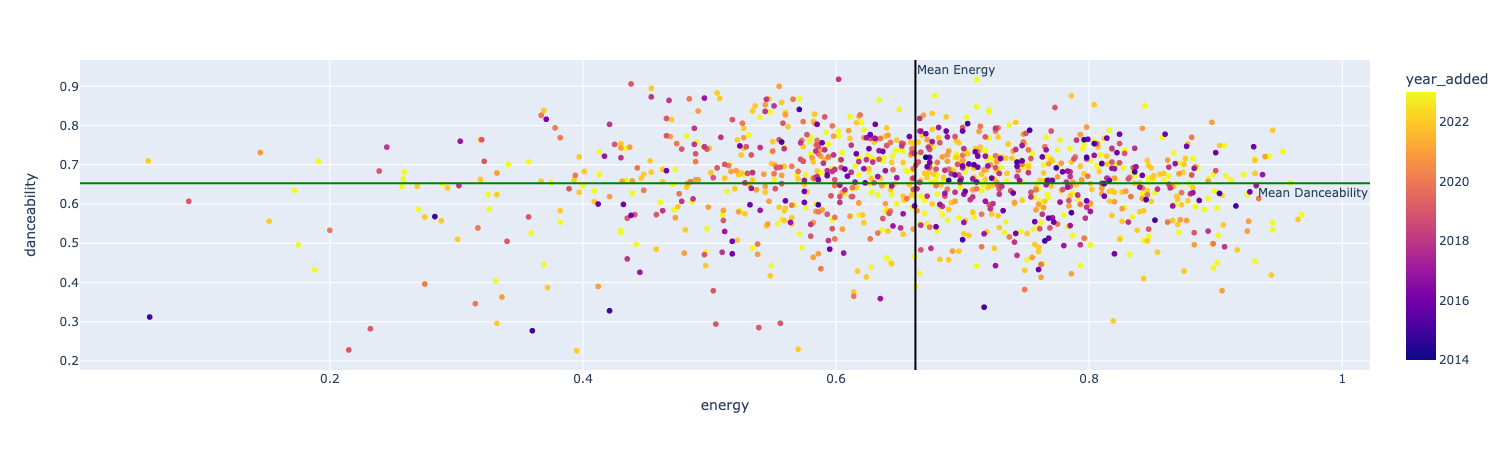
Or, if we wanted the plotly image with all the “hover_data” available when one mouses over a point:
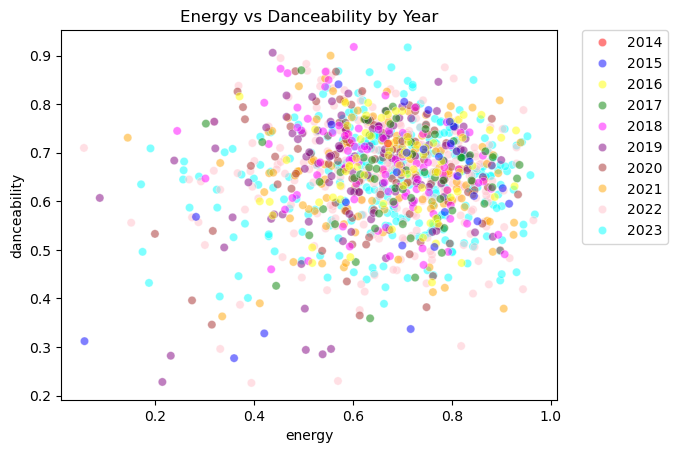
I also tried to create some plots that would include when the song was added to the playlist to see if there was anything that could be said about potential changes in taste over time:
Ooooh, and what about “energy” and the song’s “tempo” …?
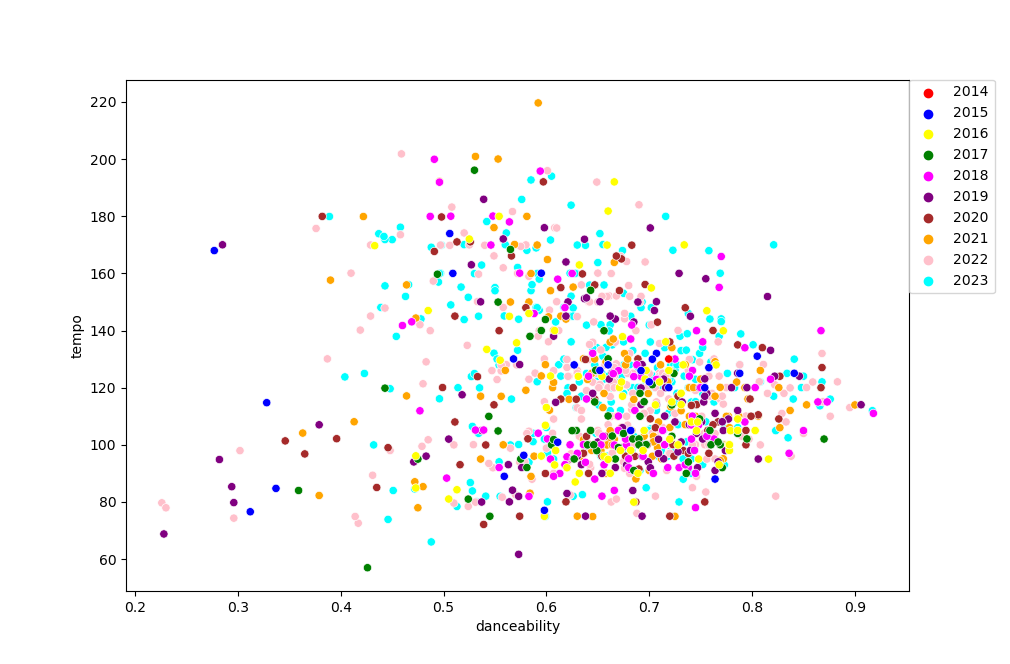
I think there’s very little doubt that the numbers here for me are a bit of a mess, to say the very least:
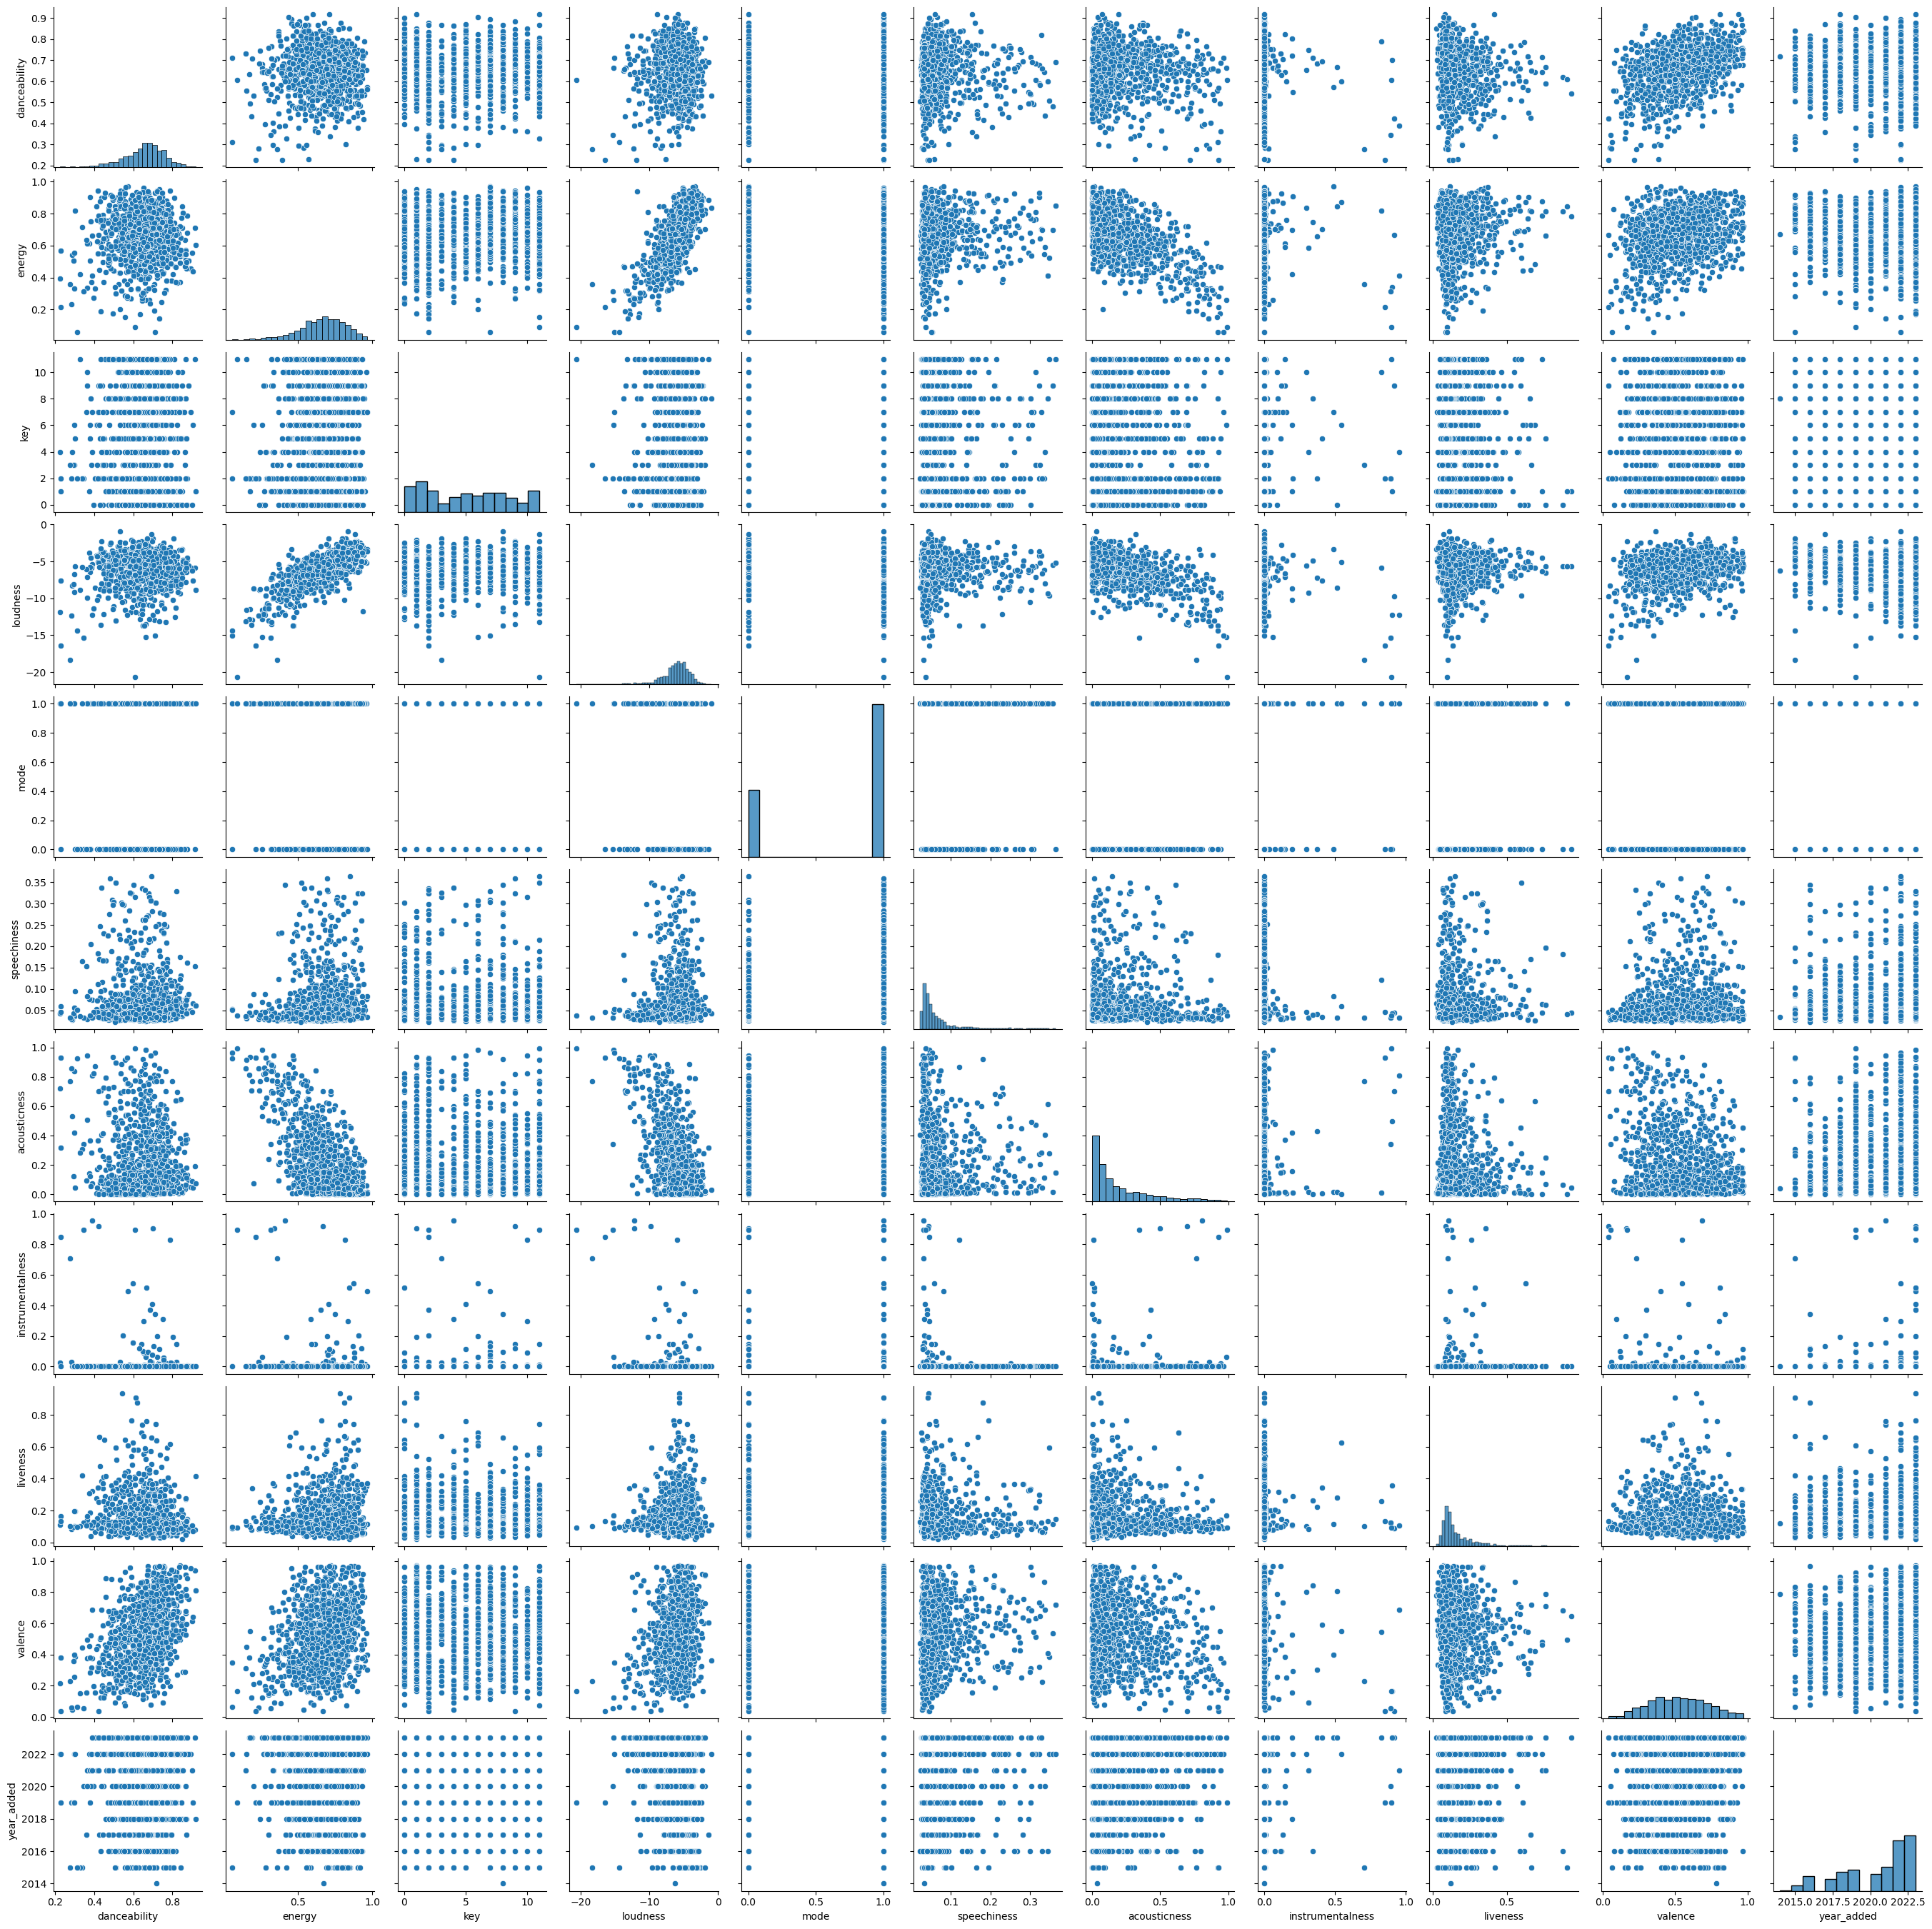
And even if we make some plots with the most “recently added” songs to them, again, it would seem that things fall within a somewhat sizeable range, at least when it comes to these “danceability” and “energy” numbers:
Yeah, not quite sure what conclusions to draw here from all this just yet …
Appendix
So, earlier I mentioned wanting to have some other users to compare my numbers with—and during the composition of this post my second most favorite student ever (I know, I know, we joke quite a lot about this unfortunate moniker), William, offered to share his Spotify data with me (I’ve mentioned William before in previous posts). Now, in William’s case, he actually knows quite a bit about music (a ton, actually), given that he is an avid guitarist and piano player. He loves to talk to me about music—when working through difficult philosophical ideas, ten times out of ten he reaches for a musical analogy with which to think through a concept … I play the game and pretend as well as I can that I understand, but, as he knows, I literally don’t have a single musical bone in my body, sadly to say … I know, too, that I think he and I are really quite different from one another in terms of our musical tastes. Do the numbers bear that out? Well, how about we return to our “danceability vs. energy” scatter plots and see how William and I compare. My guess is that these plots will show very little overlap, if any. Is that the case? Well, let’s write some code and see:
Lol, so, pictures are nice, but maybe we can grab some numbers? As those in the data science field know, the “Jaccard index” (or “Jaccard similarity”) can give us a nice numerical representation of how “similar” William’s numbers are to mine. Code for this gives us a Jaccard similarity of, literally, 0.00.) This would appear to bear out my own intuitions here … :)
Oh, and since we’re oh the “comparison train” here now, I wondered about my “valence” scores in comparison to his—again, my intuition was that I was just slightly more on the “happy” side than him? Do the numbers support that?
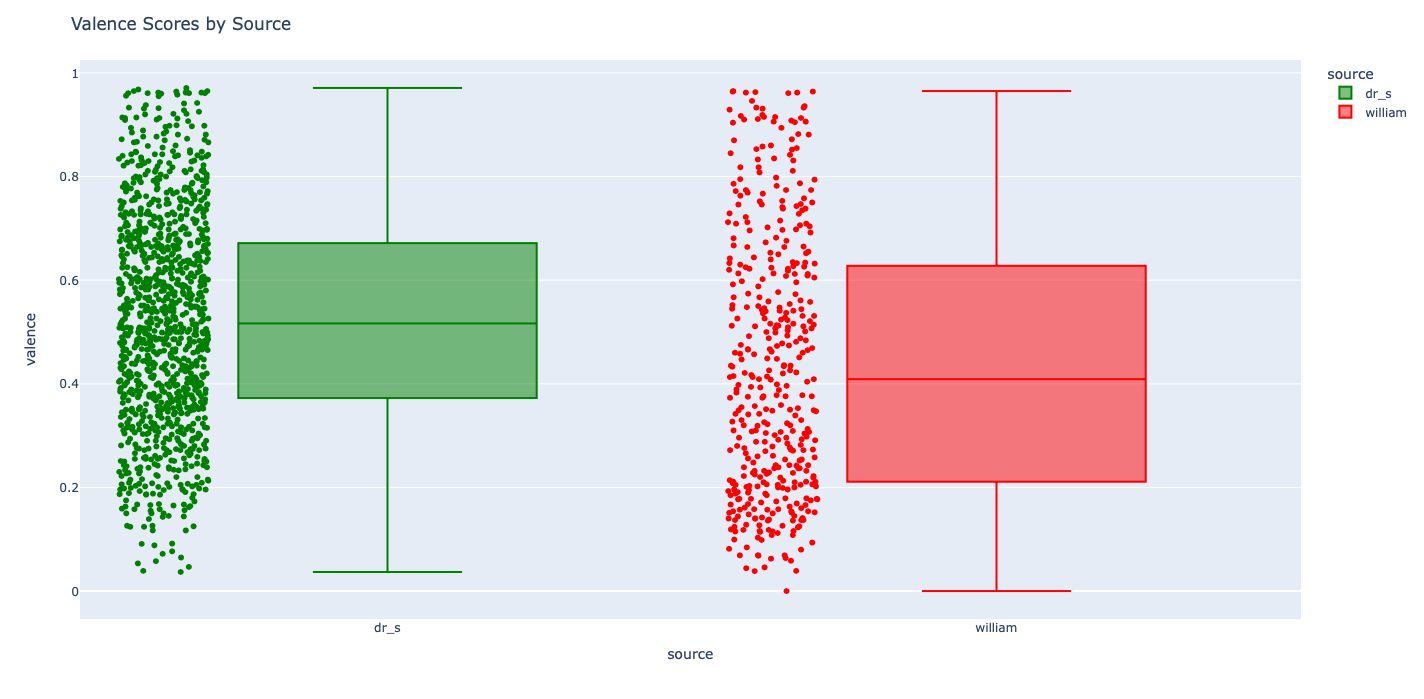
Hehehehe, I guess so, but perhaps only “barely so” … :) Obviously, there’s much more to be done here, especially now that I have William’s data … as is so usual, “more to come,” to be sure.
API apis python requests spotify data analysis requests library pandas seaborn data visualization data analysis spotipy library
1538 Words
2023-10-21 00:01