4 minutes
Letting Excel Go and Departmental Assessment Reports
For those that work in disciplines that are much closer to STEM fields than me over here in philosophy and literature, I have no doubt that most of what I want to showcase here will no doubt be the height of banality. As Department Chair, a good deal of the Assessment Reports each year fall to me. Historically, for the past couple of years I have been more than content to simply just keep all of the scores on our assessed outcomes in one gigantic Excel spreadsheet. This thing certainly kept and held all the numerical data, but it was a bit of a monstrosity—and as the years went by and all the different kinds of courses and kinds of products our students produced to meet all these outcomes increased and multiplied, it became a little unwieldy.

The file expanded and expanded with all of these tabs, all these extra worksheets, where I tried to keep track of all of these different kinds of things. There is no doubt whatsoever that all of it makes perfect sense to me—I thought I had some sense of where everything was, which cells linked to which other cells on other sheets, so on and so forth. But as time went on I think a lot of these connections became a little frayed to me and I started to wonder if the web here was all that legible. And then the thought of whether or not all these sheets would be legible to someone other than me was icing on the cake. (I kept thinking of those passages from Henri Bergson’s Creative Evolution where he goes at the age-old philosophical distinction between “order” and “chaos” by thinking about the moment when one enters my incredibly “messy room” and declares it disordered. For me, there’s nothing “disordered” about the room; everything makes perfect sense to me, the clothes are where they are because I threw them there, the bookshelves are stacked three levels deep for all kinds of good reasons—and besides, I know exactly where the Nietzsche section is, I’m good with Kierkegaard, and goodness knows I’d never forget where the Freud and Lacan are in all this “disorder” and chaos.)
And then, after doing a bunch of work making my way through Codecademy’s data analytics path, I came across Jean-Nicholas Hould’s “Tidy Data in Python” post from a number of years ago now and it was quite a Eureka! moment for me, in so many ways. Again, granted, a Eureka! moment for a total data science neophyte was nothing short of an absolutely inchoate banality for the expert, but none of this lessens the power all this new learning has had for me as of late. Yup, my departmental numbers were in an incredibly “messy dataset” as Hadley Wickham and Hould describe it. So, as the deadline for annual departmental assessment reports rolled around I spent some time tidying up this rather messy dataset. I moved things around with newly-acquired data wrangling skills and got things into a form and structure that followed Wickham’s suggestions—as Hould writes:
- Each variable forms a column and contains values
- Each observation forms a row
- Each type of observational unit forms a table
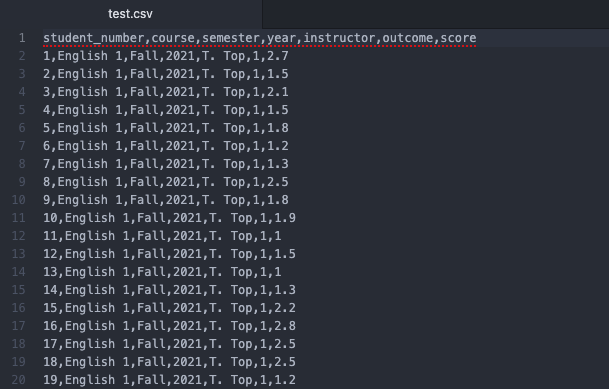
Six years of data—all in one simple CSV file—no more jumping between worksheets in one big file, no more leaping from sheet to sheet to generate graphs or to calculate even the most basic of summary statistics. Again, very far from high-powered machine learning models, K-means clustering, and all of that—just simple data tidying that even the most rudimentary knowledge of the pandas library in Python can start to work on quite nicely, quickly, and simply. Nothing fancy, just a nice clean .csv file:
With all that in place it was just a simple hop, skip, and a jump to some simple visualizations of the data:
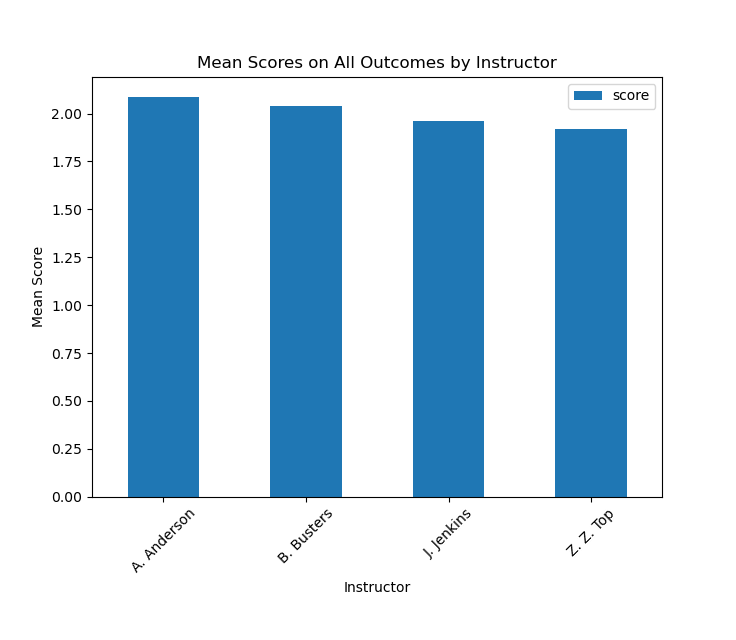
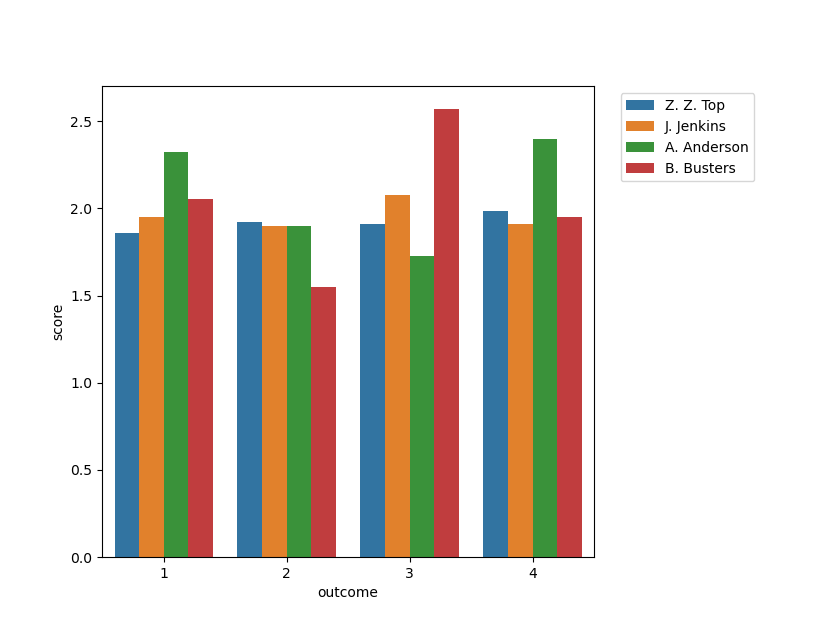
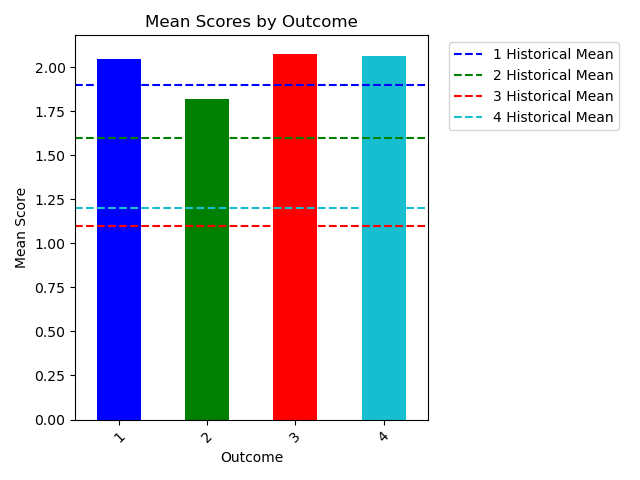
Again, nothing fancy, but just a whole lot easier to work with everything when it’s nice and “tidy.” Working with and querying the data became so much simpler—a line of code here and there and I could get information about averages—both current and historical—, information on student performance based on instructor, performance on individual outcomes, and so much more. And all because the data was cleaned up. Not to mention that with the structure in place going forward adding to the dataset becomes even simpler as well.
The repo with simple scripts for all this dummy data along with the visualizations is here.
digital humanities Python pandas data analytics python data wrangling Markdown Pandoc data wrangling tidy data in python data munging Codecademy assessment English Department Assessment Reporting
743 Words
2022-01-18 14:19